By Nat Bullard, Senior Contributor, BloombergNEF
BloombergNEF’s New Energy Outlook is our company-wide effort to describe future pathways for the global energy economy. Its two scenarios describe a world that is likely to happen, given current policies and technologies, and a world that could be, with concerted and sustained effort to reach net zero carbon emissions by the year 2050.
That first scenario is BloombergNEF’s Economic Transition Scenario, a baseline assessment with cost-based technology improvement as the prime mover of change. It is the likely world, and it is a world with 2.6 degrees C of warming. The second is the Net Zero Scenario, which includes the same technology attributes, but it also posits a world that does much more. It is a world that deploys more renewables, but also more nuclear and other dispatchable low-carbon technologies in the power sector. It scales up clean fuels in end use applications, in particular hydrogen and bio-energy. It is a sector-by-sector approach to meeting the goals of the Paris Agreement. And, while this scenario reaches net zero emissions by mid-century, it still results in 1.77 degrees of warming.
That sector-by-sector approach is important, and this year, for the first time, BNEF is producing a set of separate reports which examine particular sectors and their decarbonization possibilities. These include reports on the global industrial sector, electrical grids, and coal, which BNEF clients can access here. But just as important as what each sector can do to decarbonize, is what each country can do. That is why BNEF is also publishing a series of New Energy Outlooks on a half-dozen critical countries and markets: China, Europe and Australia so far, and soon Japan, the US, and India.
The world’s biggest energy economies share some universal attributes for decarbonization. All benefit from the same technology cost curves for wind power, solar modules, lithium-ion batteries, and hydrogen electrolyzers. These economies have large, liquid, and generally robust capital markets that can finance the trillions of dollars needed to decarbonize their economies. They also have the technical capability to integrate new power generation resources, and new molecular energy carriers like hydrogen.
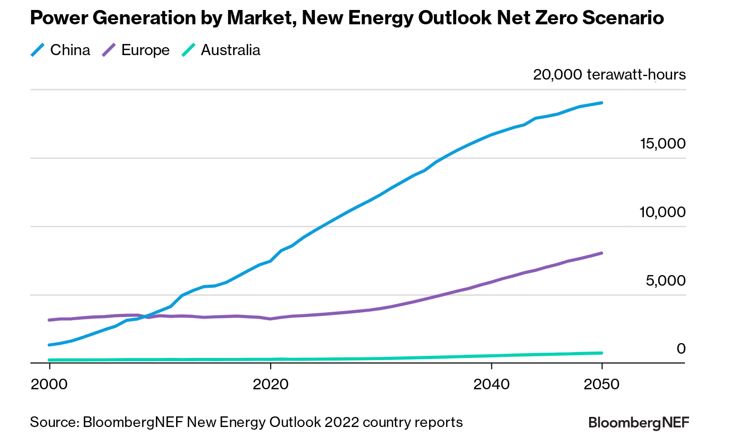
But each of these energy economies are also distinctly different in meaningful ways. Clearly, they have different scales. China, which generated only about a third as much electricity as Europe as recently as 2000, now generates more than twice as much. In recent years, China’s year-on-year increase in power generation has been much more than Australia’s total power generation. In a net zero scenario by mid-century, China will generate as much electricity every six months as Europe does every year; it will generate as much electricity in two weeks as Australia does in 12 months.

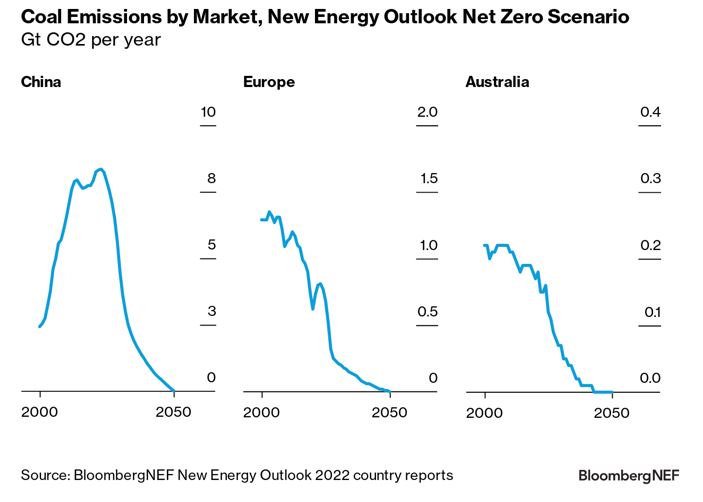
These energy economies have substantially different fossil fuel mixes. China relies heavily on coal and is far and away the world’s largest consumer of the fuel for both power and industry. Europe and Australia both reduced emissions from coal combustion by about half in the past 20 years.
Again, though, scale matters. China’s emissions from coal combustion today are about ten times higher than Europe’s, and Europe’s coal emissions are about five times higher than Australia’s. Changing China’s coal emissions trajectory means replicating every success to date in Europe and Australia but at orders of magnitude greater scale.

While these markets share the same fundamental decarbonization tools, each has its own ideal set of approaches to optimize their investment to reach net zero greenhouse gas emissions.
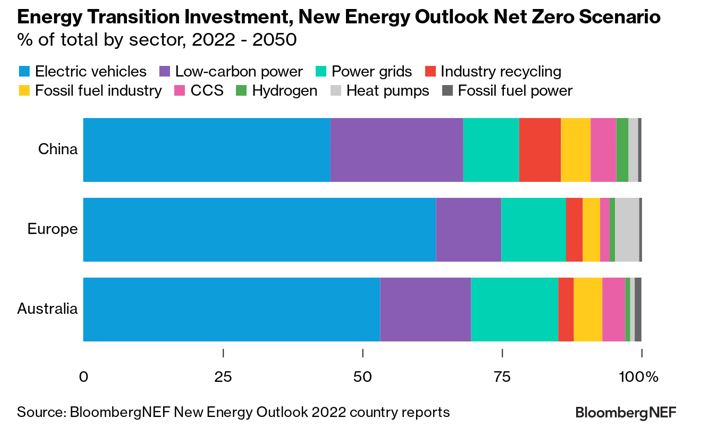
- For China, BNEF analysis finds that the cheapest path to zero will be by maximizing deployment of today’s technologically mature wind and solar power generation technologies. In addition, wide deployment of energy storage, nuclear power generation, and carbon capture and storage technology attached to its vast thermal power fleet will help the country reach net zero.
- For Europe, reaching net zero will require substantial investment in the demand side of its energy equation, including electric vehicles, heat pumps, and sustainable materials. Where China’s solutions are primarily about energy supply, two-thirds of the investment needed for Europe to achieve net zero emissions will be in energy demand technologies.
- For Australia, the net zero pathway resembles China’s: a rapid deployment of wind and solar power generation, and a wide deployment of low-carbon backup power generation technology. In addition, Australia can become a major producer of zero-carbon hydrogen using zero-carbon electricity. And not only meet its own hydrogen needs; Australia could export enough hydrogen to meet 6% of demand for the fuel by 2050.

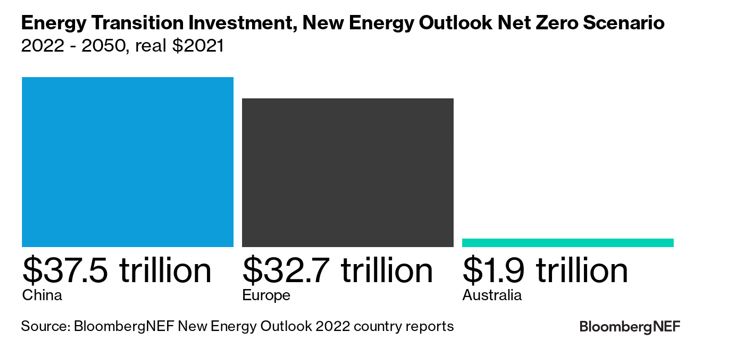
Finally, the sheer volumes of capital required to pursue net zero differ widely. China and Europe both have needs topping $30 trillion in real 2021 dollars. Investment in Australia is a tiny fraction of that, at less than $2 trillion.
Regardless of the economy, an exceptional amount of capital will needs to be deployed over three decades. Australia must invest as much as the entire global economy did in 2021 and 2022. China and Europe will each need to invest more than five times as much as the world has invested in energy transition from 2004 to 2022.

That investment, though, is not money simply thrown out the door. Rather, it represents opportunity and business transformation. Money allocated towards net zero greenhouse gas emissions goals will change the way that today’s incumbent energy and industrial sectors operate, and create new business champions as well.
Download the New Energy Outlook country report executive summaries here.
Clients can read the full reports here:
China link
Europe link
Australia link
The next country reports in the New Energy Outlook series will cover Japan, the US, and India.