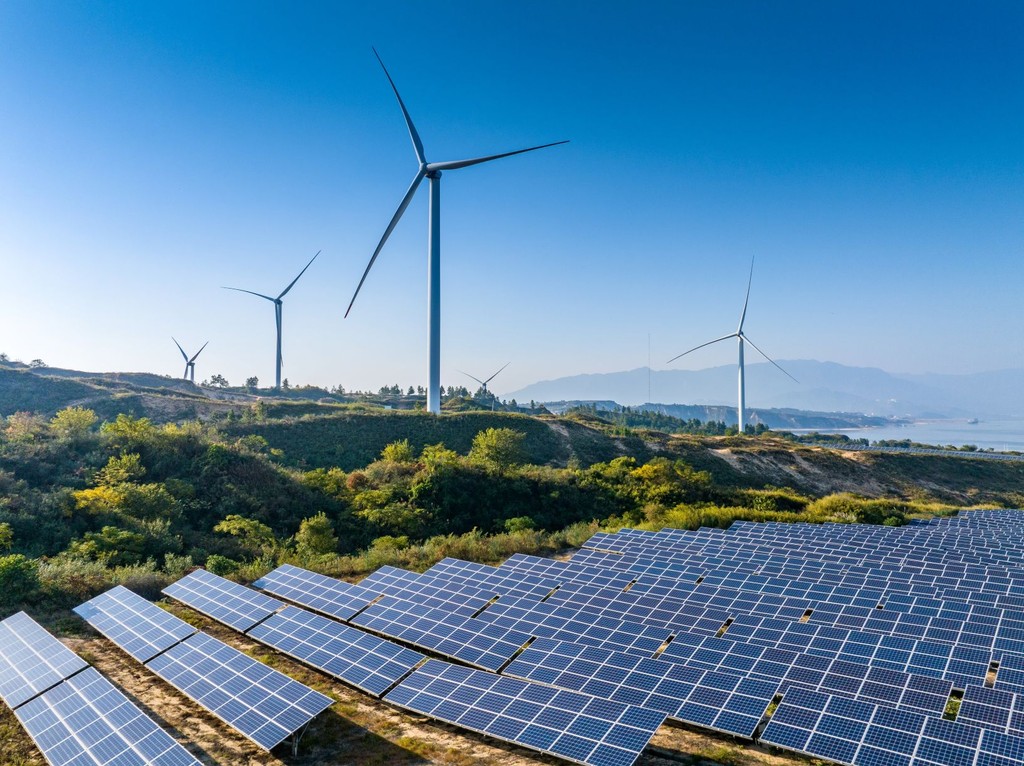
Climatescope 2019 profiles 104 emerging markets worldwide and evaluates their ability to attract capital for low-carbon energy sources while building a greener economy. For the first time since BloombergNEF began the Climatescope survey, India tops the rankings. The Asian nation is followed in the top five by Chile, Brazil, China and Kenya. Below we describe what drove each of the top five markets to the top of the ranking.

1. India
India’s ambitious policy framework and copious capacity expansions pushed the country to 1st position in 2019, from 2nd in 2018. The Indian government has set one of the world’s most ambitious renewable energy targets by aiming for 175GW by 2022, with 100GW to come from solar, 60GW from wind, and 15GW from other sources.
India has also held the most competitive and largest auctions for clean energy power-delivery contracts. These resulted in the procurement of the equivalent of 19GW in 2018 alone. Together, these developments pushed the country to the top of the table on its Fundamentals score and 3rd on Opportunities in the Climatescope ranking.
Renewables, excluding large hydro, account for 81GW of India’s 356GW capacity. Since 2017, capacity additions from renewables have exceeded those of coal. While wind capacity additions of 2.3GW in 2018 were 44% below 2017 levels, solar saw its best year to date with 9GW installed. This included utility-scale, rooftop and off-grid capacity. Wind’s 2018 decline was partly due to a switch in the market from a reliance on feed-in tariffs to reverse auctions.
2. Chile
Chile’s exceptional natural resources, along with (until very recently) a stable government and healthy economy have made it attractive to clean energy investors. The government has set ambitious long-term clean energy goals and begun implementing policies which make renewables more price competitive. Targets include a clean energy mandate of 20% of generation for utilities by 2025 and 60% of generation by 2035. By 2050, the country aims to have 70% renewables generation. This led to Chile finishing 2nd in the Fundamentals section of the Climatescope ranking. (It should be noted, however, that recent events have certainly called into question the stability of the Chile market and Climatescope scores are based on a country’s status as of the prior year-end.)
At the end of 2018, Chile had 2.3GW of solar and 1.5GW of wind online. This represented 16% of total installed capacity and renewables (excluding large hydro) accounted for 15% of all power generated. Wind generation in Chile surged from 1.4TWh in 2014 to 3.6TWh in 2018, while solar output spiked from 0.5TWh to 5.1TWh. Together, wind and solar represented 11% of total 2018 power generation, up from virtually nothing five years ago.
3. Brazil
Brazil continues to be one of the main emerging markets for renewable energy deployment and the largest power market in Latin America, with a total installed capacity of 162GW in 2018. Its matrix remains highly reliant on hydropower, which accounted for roughly 65% of the country’s generation in 2018. However, penetration of non-hydro renewables generation has been growing year-on-year and reached a peak of 18% in 2018.
The country has a comprehensive and inviting clean energy policy framework and has pioneered competitive auctions to contract clean energy, which led to over 28GW of renewable energy contracted 2009-2018.
With the worst of its economic crisis now behind it and plans to hold two auctions per year 2019-21, clean energy appears poised for renewed growth. Brazil attracted almost $56 billion in new asset finance for clean energy plants 2009-18, by far the largest amount in Latin America over the period.
4. China
A decade of nearly uninterrupted growth in clean energy in China came to an abrupt end in 2018. Changes to critical policies resulted in new investment sinking to $86 billion in 2018 from $122 billion the year prior, and new-build for clean energy dropping to 71GW from 76GW. Generous feed-in tariffs that were the norm for much of the past decade are coming to an end. Despite this, China still represents a land of enormous potential for renewables, scoring highest among all Climatescope countries for Opportunities.
Although coal still dominates China’s power system, accounting for 54% of capacity and 65% of generation in 2018, both figues are down nearly 10 percentage points from 2012, demonstrating the speed of change. Wind and solar together now account for 20% of capacity and almost 8% of generation in China, up from just 3% and 13%, respectively, in 2014. Generation from renewables continues to grow, not only due to growth in capacity, but also because of reduced curtailment. China’s grid companies have deployed multiple approaches to incorporate more renewables, including generation rights trading, expanded inter-regional power transfer, thermal generator flexibility retrofits and spinning reserves reduction. The result is historically low national average curtailment rates of 7.2% for wind and 3.0% for solar in 2018.
5. Kenya
A boom in clean energy investment in 2018 along with Kenya’s extensive renewable energy value chain pushed the country to 5th position in the survey. Kenya is gradually boosting the contribution non-large hydro renewables make to its grid by adding more solar, wind and geothermal capacity. In 2018, non-hydro renewables accounted for 38% of the country’s capacity and 49% of generation. This is set to continue growing as clean energy investment reached a new record in 2018 with $1.4 billion attracted for geothermal, wind and solar plants.
The country is in the process of shifting from feed-in tariffs to reverse auctions as its primary means for spurring new-build. In August 2018, the parliament approved draft legislation to make this change but final action is still required. Under the last set of feed-in tariffs offered, the government received applications from over 4GW of clean energy projects. While this signalled the strength of the local development pipeline, it was also far more than the Kenyan grid was ready to absorb at the time.
More from Climatescope 2019 findings here.


