
There is uncertainty in the financial, business, and policy making community regarding the level of energy investment and financing compatible with emissions pathways published by major intergovernmental bodies such as the IEA and IPCC with no or limited overshoot of 1.5°C. This work offers insight on the range of energy investment outlined by the different scenarios. This volume assesses the most ambitious scenarios from the recent IPCC assessment report six, released in April 2022. Specifically, these are C1 – SP (Shifting Development Pathway), C1 – LD (Low Demand), and C1 – REN (Renewables).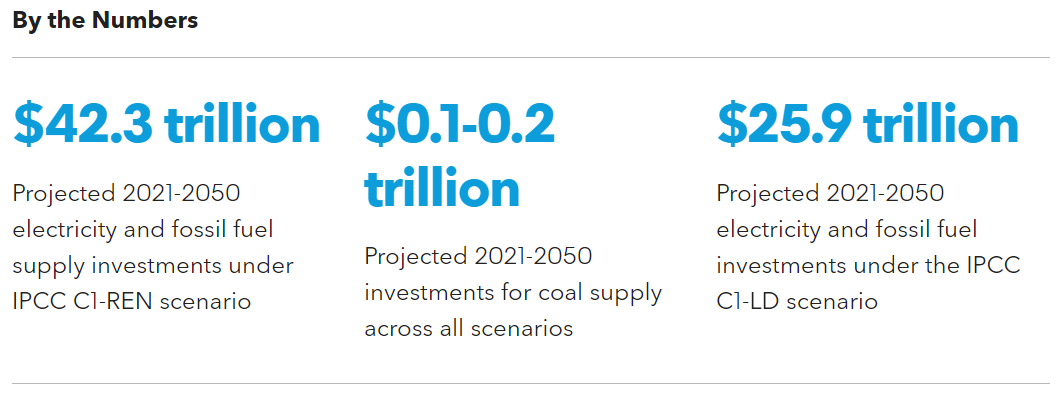
- This note evaluates three IPCC scenarios compatible with a 1.5°C rise from the recent Assessment Report 6. These are IPCC C1 – SP (Shifting Development), C1 – LD (Low Demand), and C1 – REN (Renewables) pathways. This is the sequel to an earlier note on other scenarios.
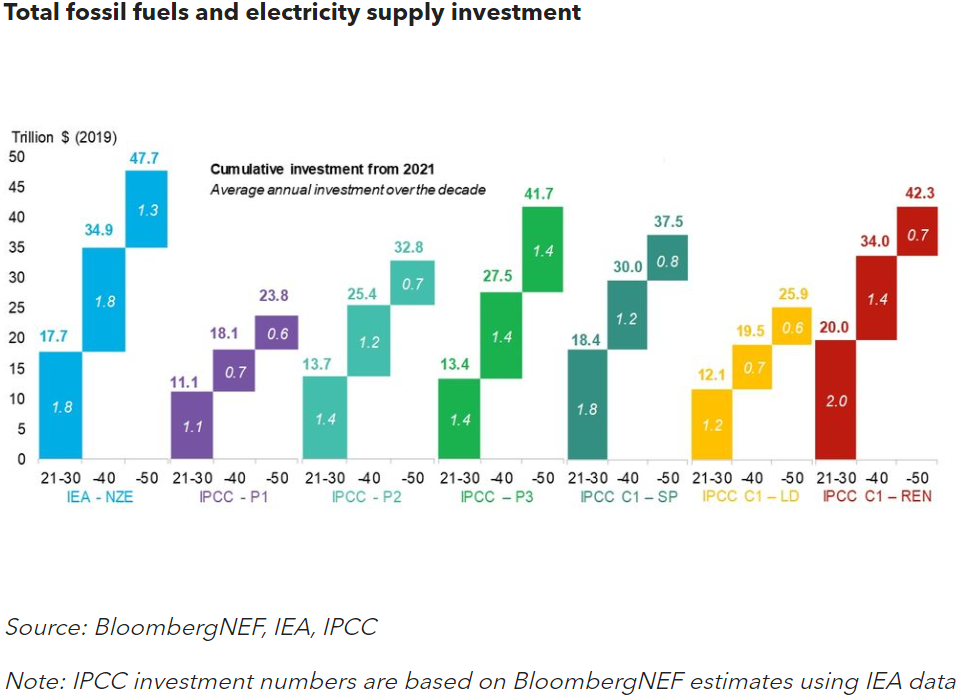
- Extrapolating from these three recent IPCC scenarios, BNEF pegs the required electricity and fossil fuel investment at $1.2-2.0 trillion per annum through 2030. Through 2050, capital needs to range from $1.1 to 1.4 trillion per year.
- Fossil fuel supply investment decelerates until 2050, although it does not fully diminish. Oil stands to receive the most investment, followed by natural gas. Coal trails far, far behind. These trends follow those in previous IPCC pathways BNEF examined earlier.
- Under all scenarios analyzed, 2020-2030 fossil fuel investment remains similar to last decade’s levels. Average annual investment in all scenarios stands around $0.2-0.9 trillion against an estimated $0.8 trillion across 2016-2020. However, the pathways diverge substantially post-2030. Under IPCC C1-LD, $0.1 trillion per annum is invested. Under IPCC C1-REN: $0.2-0.3 trillion.
- Investment in oil supply tracks at $0.6 trillion per annum to 2030 for C1-SP and C1-REN, up from $0.5 trillion/year from 2016-2020. It falls to $0.1-0.3 trillion/year to 2050.
- Investment in gas supply ranges from $0.1 to 0.3 trillion per annum to 2030 across all scenarios, in line with the $0.2 trillion/year in 2016-2020. It then declines to $0.1 trillion/year to 2050.
- Overall investment in coal supply falls close to $0.1-0.2 trillion after 2030, essentially stopping except for capital deployed to support maintenance of existing infrastructures.
- Renewables investment varies by scenario, but accounts for at least 75% of funds to be deployed in support of the electricity sector.
- Investment in renewable power ranges from $0.8 to $1.3 trillion per annum to 2030 across all scenarios. C1-REN leads the overall cumulative value to 2050 with $29.7 trillion, followed by $21.4 trillion by C1-SP.
- Investment in renewable power ranges from $0.8 to $1.3 trillion per annum to 2030 across all scenarios. C1-REN leads the overall cumulative value to 2050 with $29.7 trillion, followed by $21.4 trillion by C1-SP.
- Overall electricity supply investment stands close to $1.0-1.3 trillion per annum for all the scenarios up until 2030. This falls to $0.5-1.1 trillion per annum until 2050. (Corrects fifth bullet point in executive summary (slide 2) to “up from $0.5 trillion/year” from “down from $0.5 trillion/year“. )
The report can be found here.
Related Content


