
By Nat Bullard
Senior Contributor
BloombergNEF
The US is the world’s second-biggest electricity system, its second-biggest greenhouse gas emitter, its biggest oil consumer, its largest producer of natural gas and tied for first largest exporter of liquefied natural gas. The US energy system is very big; it is also increasingly dynamic.
Capturing that dynamism is the goal of the annual Sustainable Energy in America Factbook, published this week by BloombergNEF and the Business Council for Sustainable Energy. The report is a wealth of statistics and trends that captures something important: decarbonization is now hard-wired at the system level. Decarbonization comes from continued incremental change in some sectors; it also comes from fast-moving transformation in others.
The entire report is worth a close read. There are a few trends – some worth re-emphasizing, some perhaps hidden in the data – that BNEF thinks worth highlighting.
The US power mix is transforming
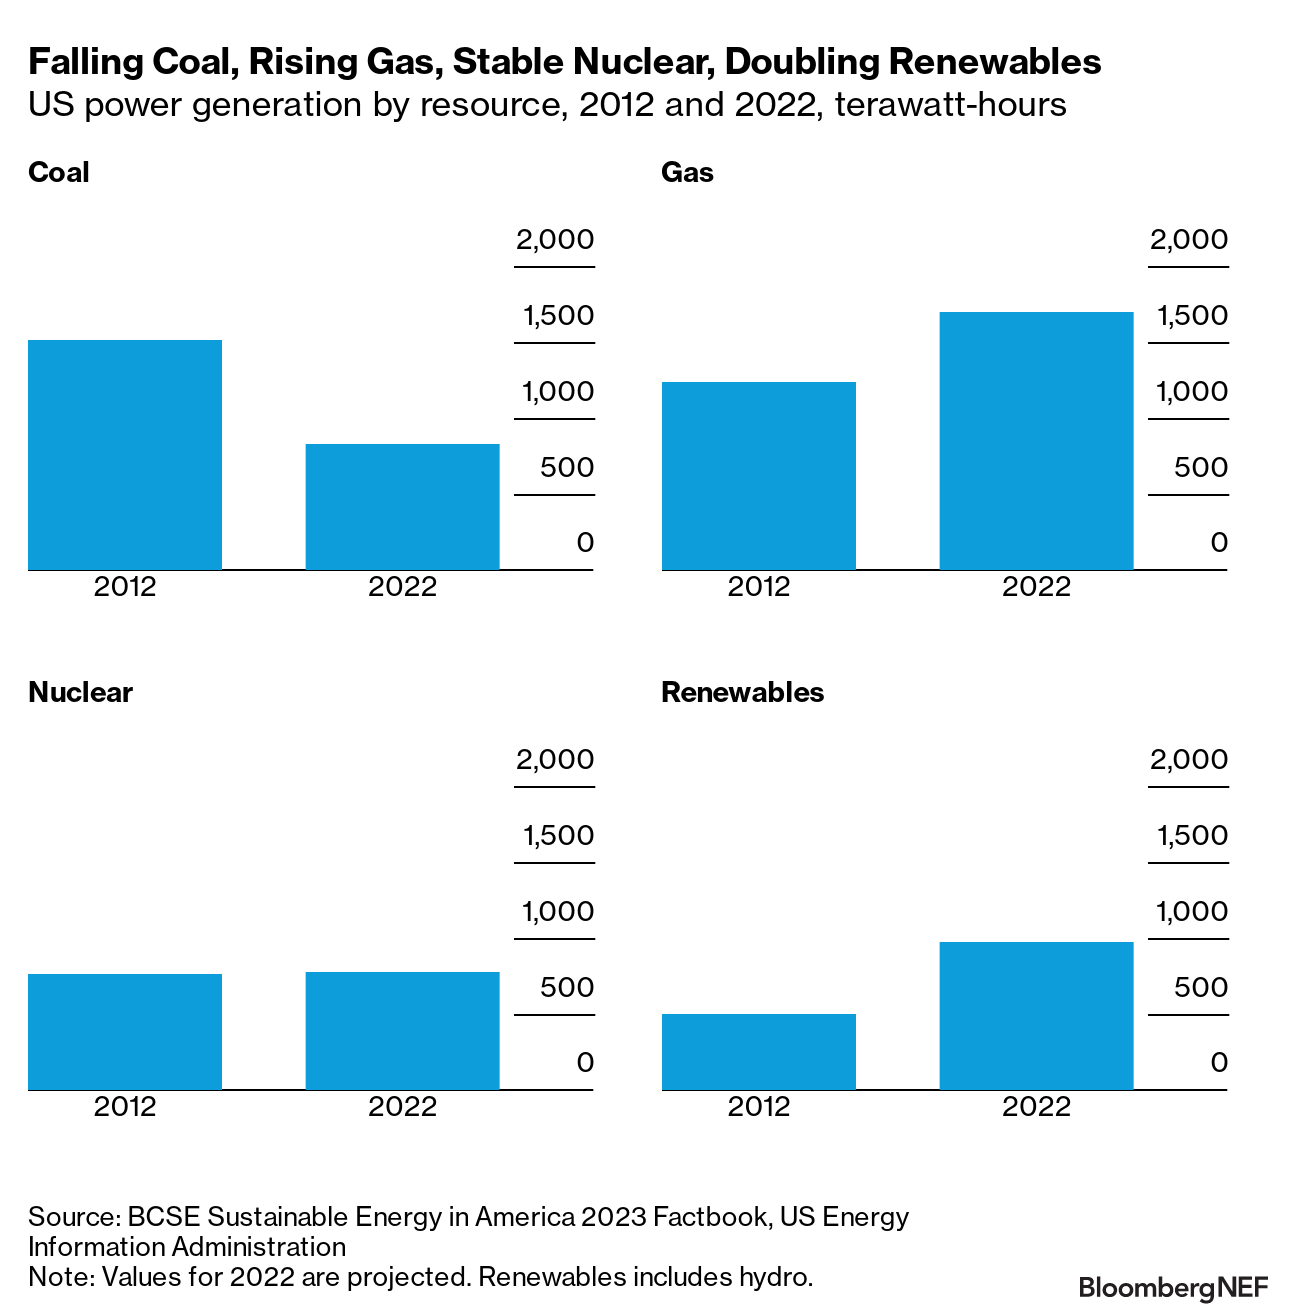
US power generation increased more than 3% in 2022, as the country continued to recover from the significant demand hit from Covid-19. Generation last year hit an all-time high of just under 4,300 terawatt-hours, topping the previous high in 2018.
The power mix continued to evolve as well. Coal-fired power is now less than 20% of total, while gas is just under 40%. Nuclear remains essentially unchanged; there is only three terawatt-hours difference between nuclear generation in 2012 and 2022. Renewables have more than doubled since 2012, to nearly 23% of the total last year.
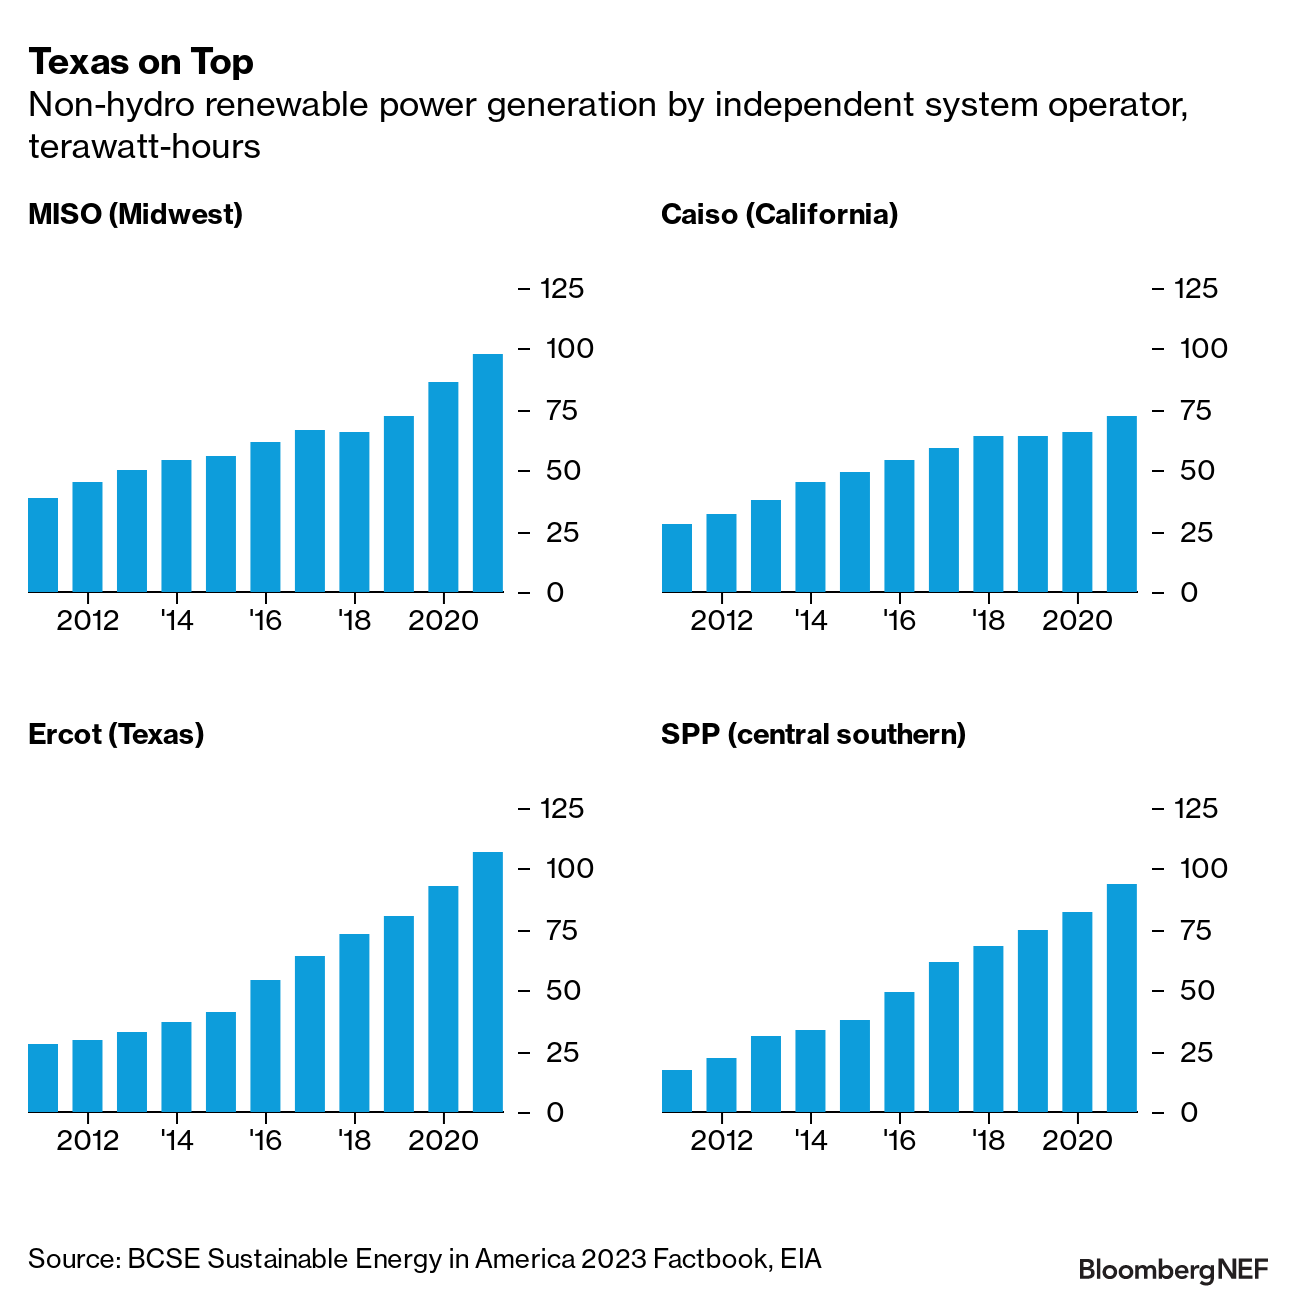
Renewable power is not evenly distributed, however. There are 10 major US power markets, only five of which have a significant penetration of renewable power. The California and Northwest markets are strong renewables markets historically. However, the growth in non-hydro renewable power on an absolute basis has been greater in three other grids. California is now the fourth-biggest market in terms of renewable generation, trailing behind the Texas, the Midwest, and central southern markets. California and Texas each generated 28 terawatt-hours of renewable power in 2011; last year, Texas generated 107 terawatt-hours to California’s 72.
The next decarbonization challenge
US power sector emissions have declined by more than a third since 2007, thanks to fuel switching and technology change. US transport emissions, now the single largest sector emitter in the US, have still declined more than 12% during that same time. Building emissions and agriculture emissions, both of which are much smaller emitters in absolute terms, have increased in the past three decades. Industrial emissions have also declined since 1990, but the much more significant change in the power sector means that US industry is now essentially tied for greenhouse gas emissions with the power sector.
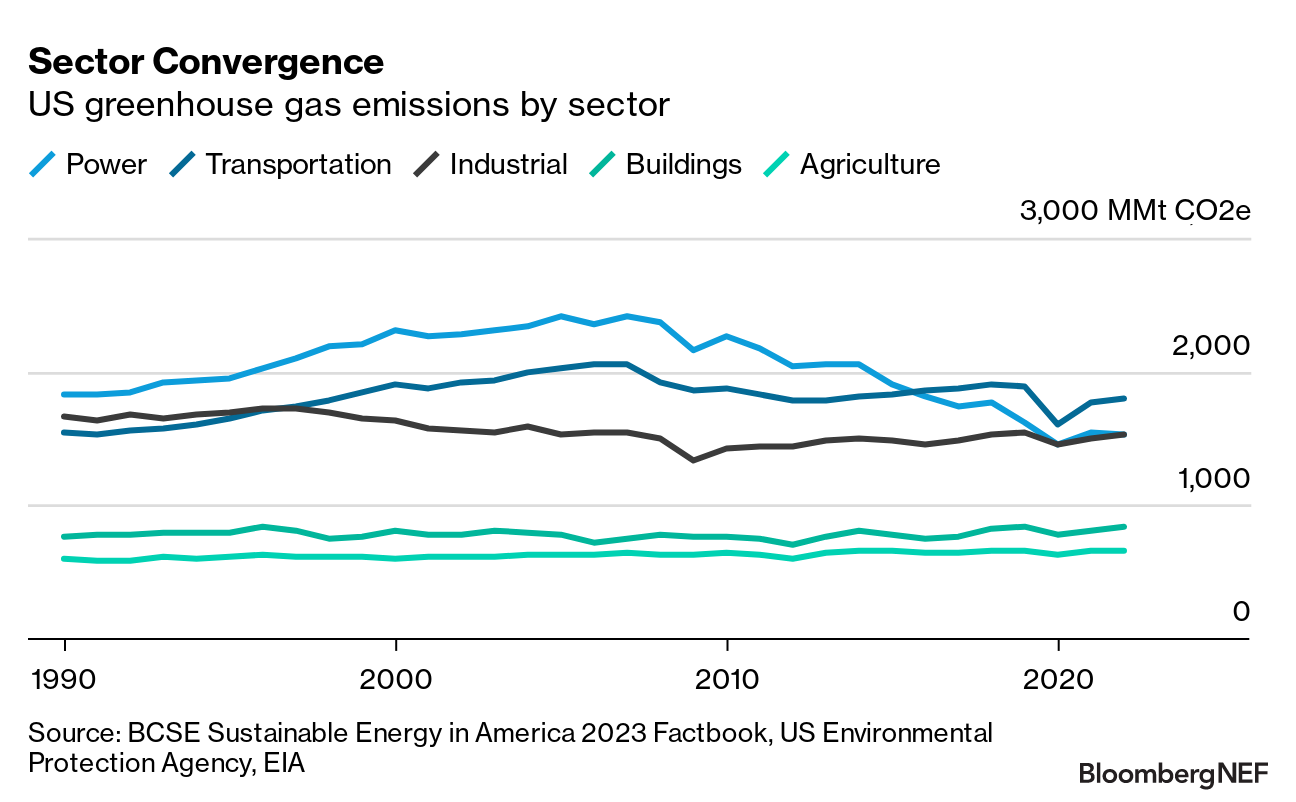
Industrial emissions are technically challenging to tackle. But the biggest tool for doing so – electrification of industrial processes – is itself becoming cleaner.
Capacity expansion is in the queue
US power generation cannot grow without new generators interconnecting to the existing transmission network. There are more than 1,000 gigawatts of power plants currently requesting interconnection across seven major independent system operators (ISOs). All have wait times for interconnection approval, much less for interconnection itself – but the wait is longer in some regions than others. The average interconnection approval wait time in the mid-Atlantic US is more than three years, and it is three years in California. Only in the Midwest is the wait for approval less than two years.
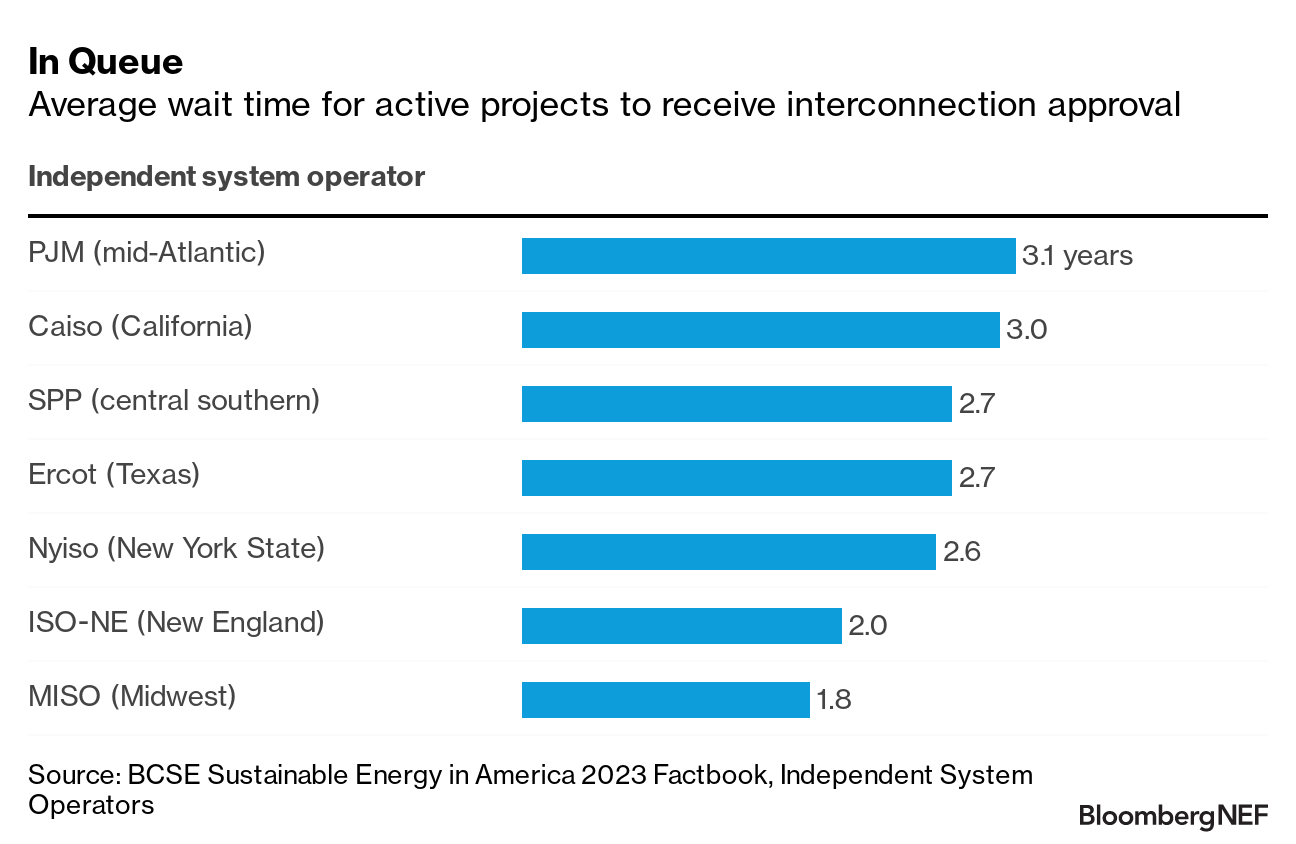
Interconnection approval is a significant bottleneck to power grid expansion, but is not the sole bottleneck. Federal permits, and environmental studies, can require as much as six years for completion.
Exports drive gas demand
US natural gas demand has increased more than 50% since 2011. Demand from power alone has increased more than 50%, from less than 21 billion cubic feet per day to nearly 33 billion cubic feet per day last year. Industrial, commercial, and residential demand have also increased, though relatively modestly.
The biggest change in US gas demand has been exports. In 2011, the US exported 1.4 billion cubic feet of gas per day to Mexico and LNG exports were still a half-decade away. Last year, Mexico exports were nearly four times higher, and LNG exports were 10.8 billion cubic feet per day – more than all US commercial sector demand.
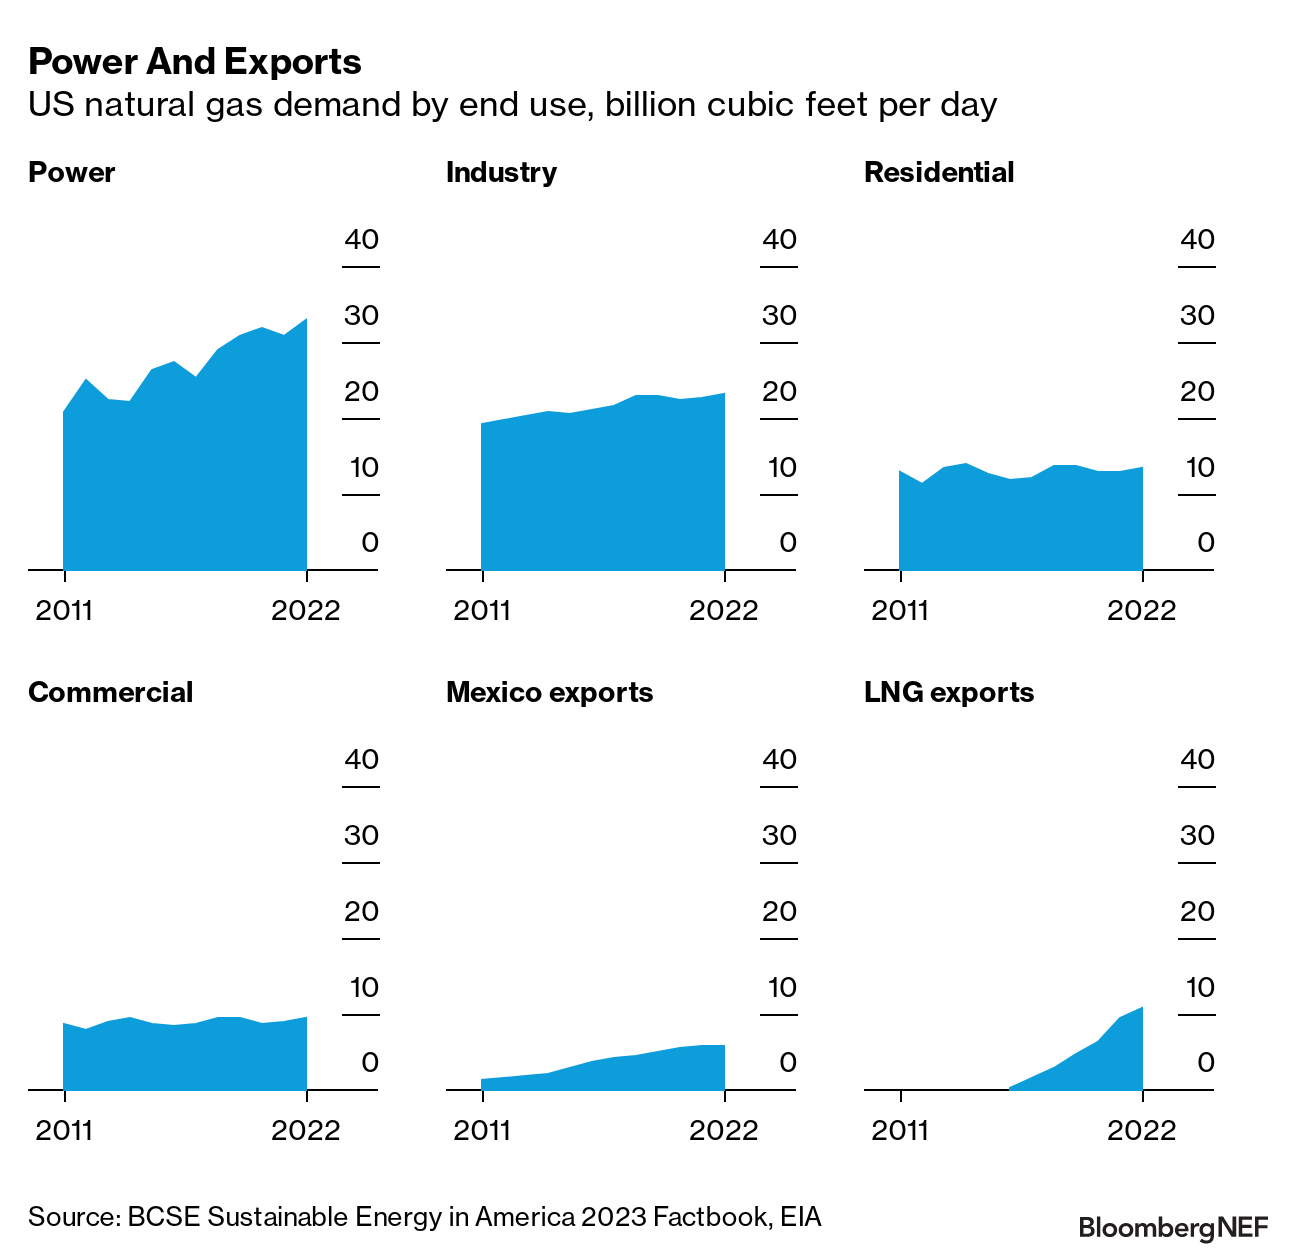
A decade ago, exports were barely over 2% of total US gas demand. In 2022, exports were more than 17% of demand, behind only power and industry, and more than all residential consumption.
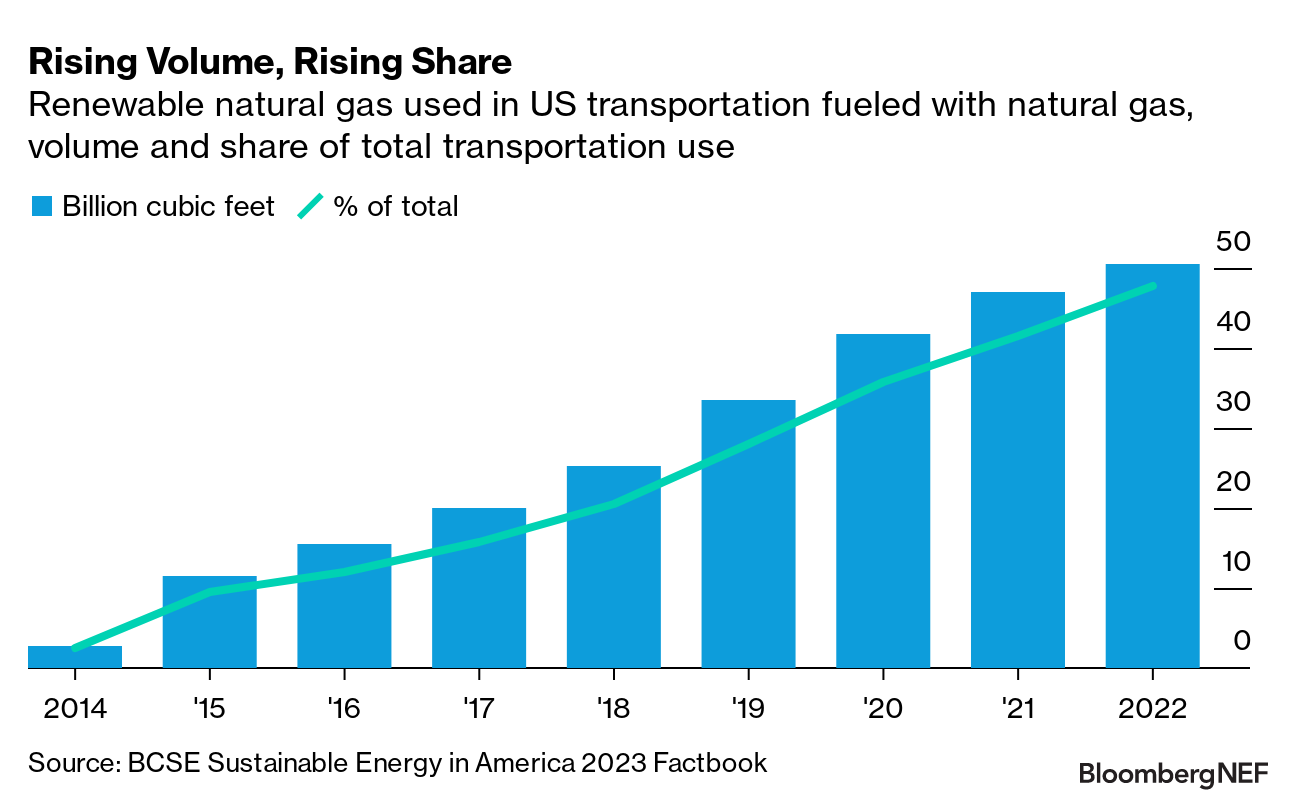
Renewable natural gas has also increased significantly in the past decade, albeit from a low base of production. To date, almost all RNG production has come from landfill sites, but more anaerobic digestion projects, which biodegrade manure and other organic matter, are under development.
The transport sector, in particular, is important to RNG, thanks to the federal Renewable Fuel Standard and California’s Low Carbon Fuel Standard. Total RNG production has increased 20-fold since 2014, and RNG now comprises almost half of the natural gas used in US vehicles (and nearly 100% of the natural gas used by the transport sector in California).
A battery manufacturing boom
The US has hardly been a battery manufacturing powerhouse. However, US battery manufacturing began increasing in the 2010s, and began ramping significantly at the end of the past decade. Lithium-ion battery manufacturing capacity increased by a third from 2018 to 2019; it increased 45% from 2020 to 2021, and 70% from 2021 to 2023. This year, annual manufacturing capacity should increase by another two-thirds, to more than 175 gigawatt-hours.
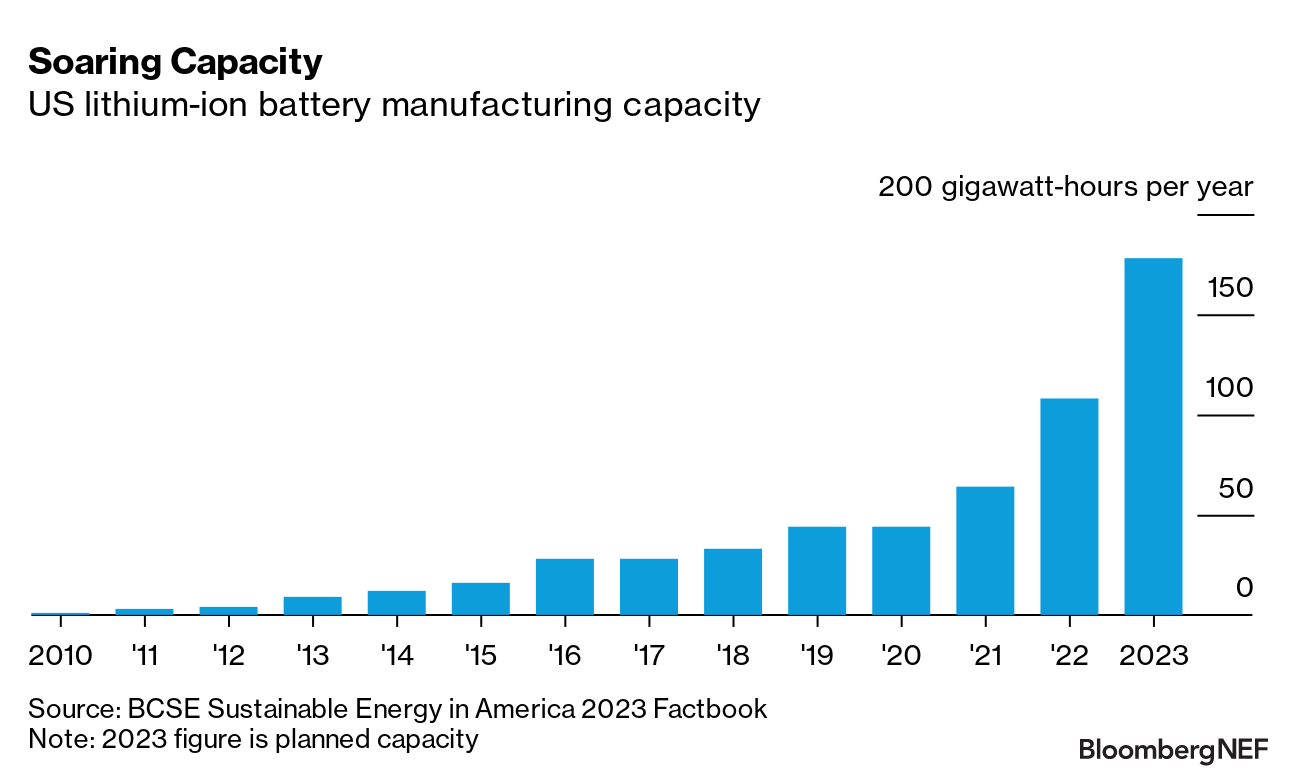
The US Inflation Reduction Act (IRA) is proving a huge boost to domestic battery manufacturers. The IRA introduced a $45/kWh cell and module production tax credit; since the bill’s package, automakers and battery manufacturers have made $17 billion worth of commitments to build out the battery supply chain in North America.
Be more efficient
There is one sustainable energy resource that the US could certainly exploit more: energy efficiency. In the 2000s, half of all US states instituted state-level energy efficiency resource standards (EERS), which require utilities to invest in measures which improve end-user efficiency. However, in the past decade, the number of states with EERS has actually declined.
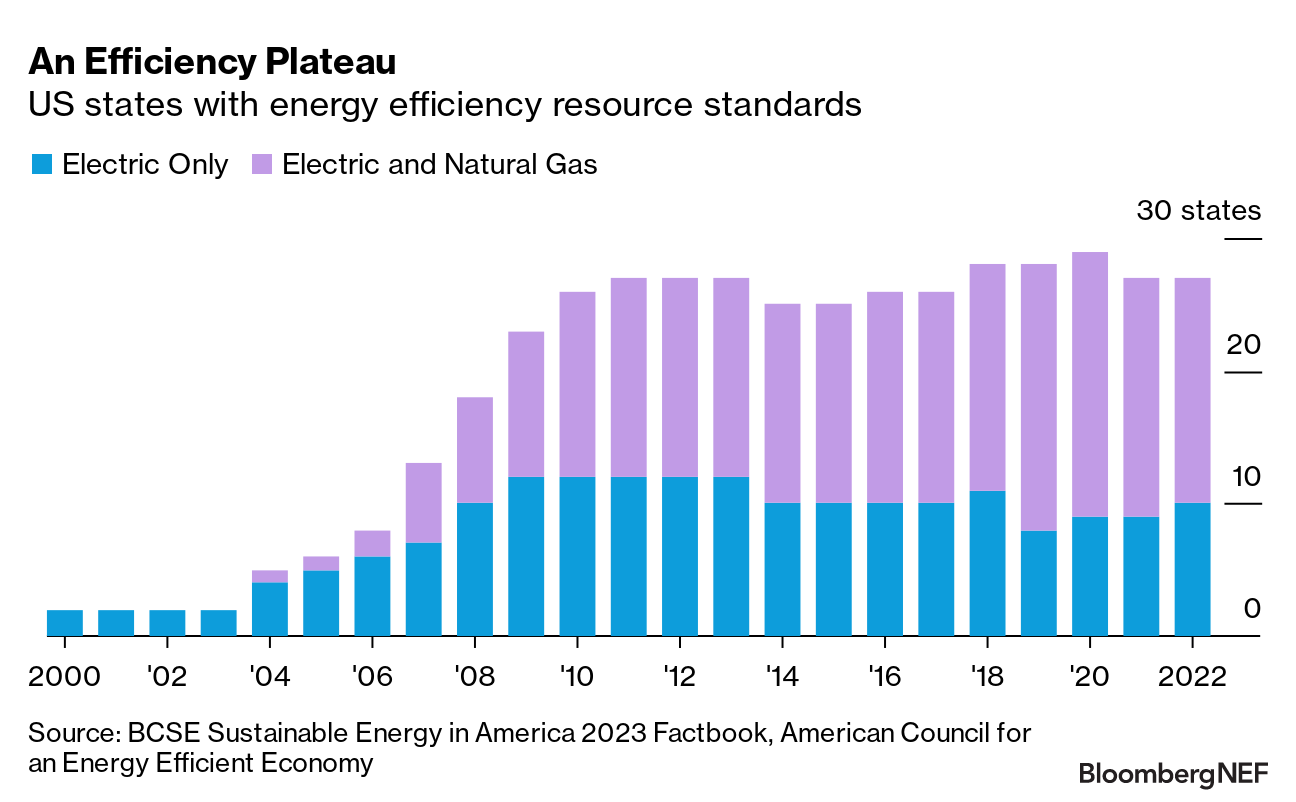
Spending on efficiency has also been flat. In 2016, utilities spent $7.6 billion on electricity and gas efficiency; in 2021, they spent only an additional $100 million. Gas efficiency spending has actually increased, while power efficiency spending is down more than 10% from its peak in 2019.
Download the complete Sustainable Energy in America 2023 Factbook
here
.
Related Content


