The energy transition and carbon pricing are driving technology disruption, reshaping demand for goods and services, and already impacting corporate cashflows.
But what does that all mean for costs and revenues? That’s the question that BNEF’s Transition Risk and Opportunity Outlook, a new annual report, seeks to answer.
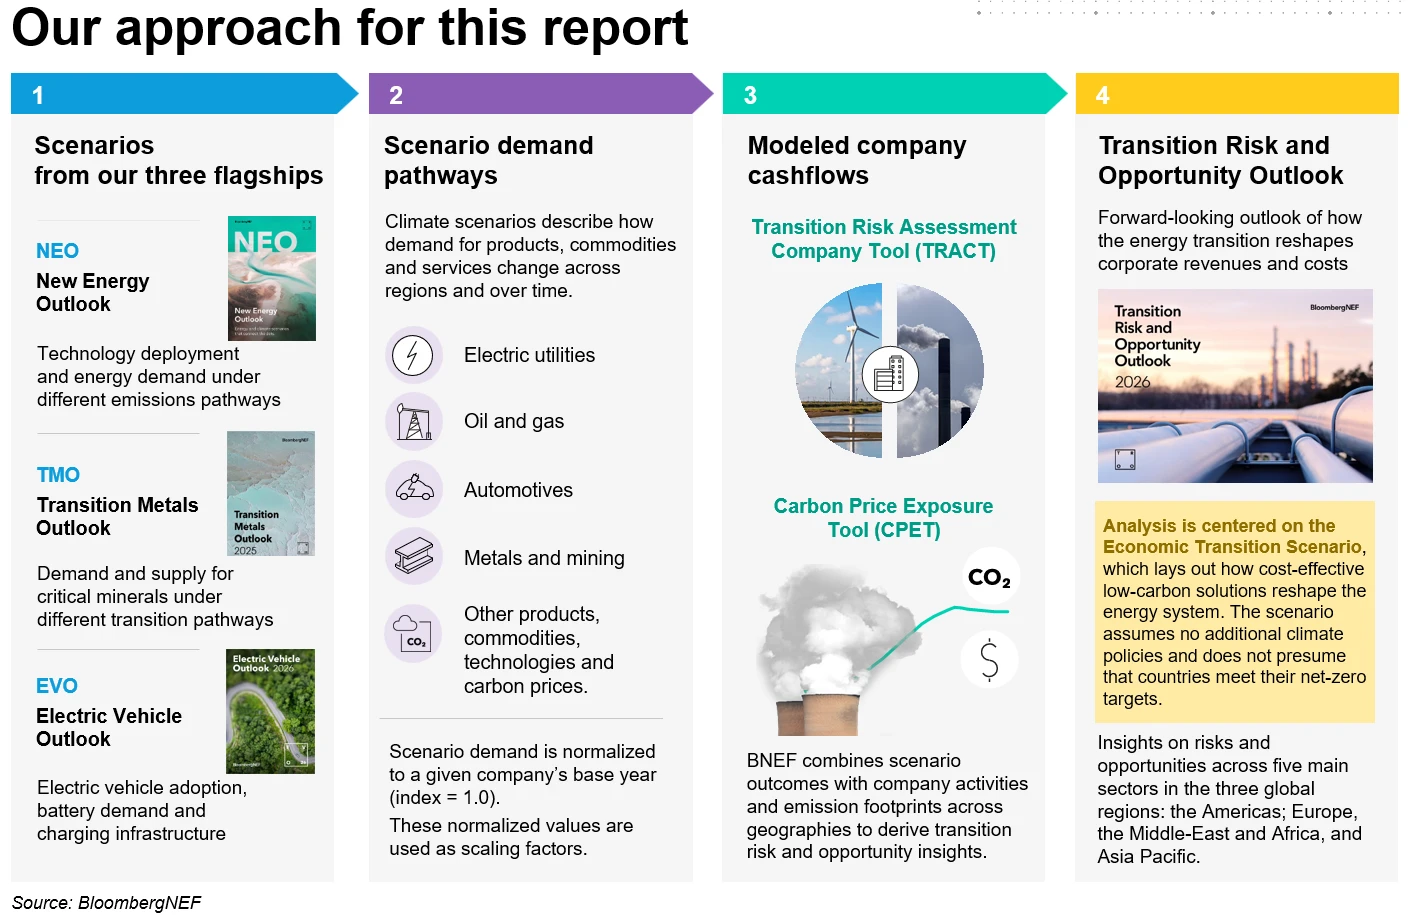
Drawing on BNEF’s proprietary Transition Risk Assessment Company Tool (TRACT) and Carbon Price Exposure Tool (CPET), the report models how the energy transition could impact cashflows over the coming decade. Specifically, it considers how finances for five major sectors – electric utilities, coal, automotives and aviation, oil and gas, and metals and mining – could transform under BNEF’s Economic Transition Scenario.
Here are three key takeaways from the report.
1. Chinese automakers benefit from a head start in capturing global EV demand, unlike European peers
Risks arising from the energy transition differ from one region to another. The automotive sector, for instance, shows a clear redistribution of winners and losers as road transport electrifies.
Chinese automakers have benefitted from a significant head start in capturing global electric vehicle demand. Automakers with high exposure to electric vehicles like BYD and battery manufacturers like CATL see their revenues increase in the coming decade in BNEF’s modeling, although these estimates depend on successful international expansion if EV sales continue to slow down in China.
Meanwhile, European automakers are already facing significant transition risks. Revenues for automakers like Renault and Volkswagen decline or plateau in the coming decade in BNEF’s modeling, as they lack material revenue exposure to the automotive sector’s electrification.
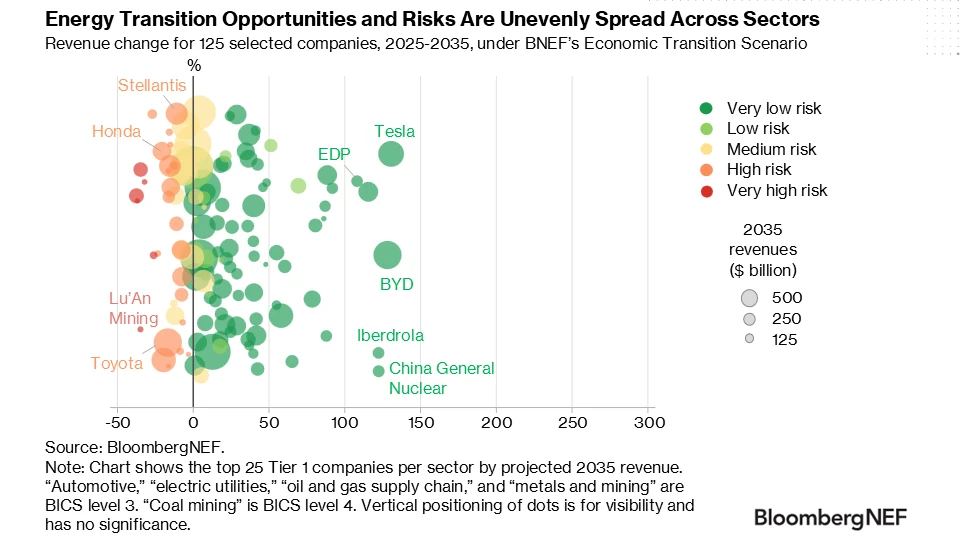
Utilities in Asia Pacific and the Americas also record declining revenues, due to their ownership of coal-fired power plants. Revenues for Australia’s Origin Energy and China’s Huaneng Power International fall by nearly half in BNEF’s modeling, due to lower run hours for coal in power grids increasingly dominated by variable renewables.
Some companies, such as Duke Energy in the US, offset dwindling coal revenues with higher generation from gas-fired power plants as cheap and abundant US gas meets rising power demand boosted by new loads like data centers.
2. New revenue opportunities can offset carbon pricing risks, but not for downstream oil
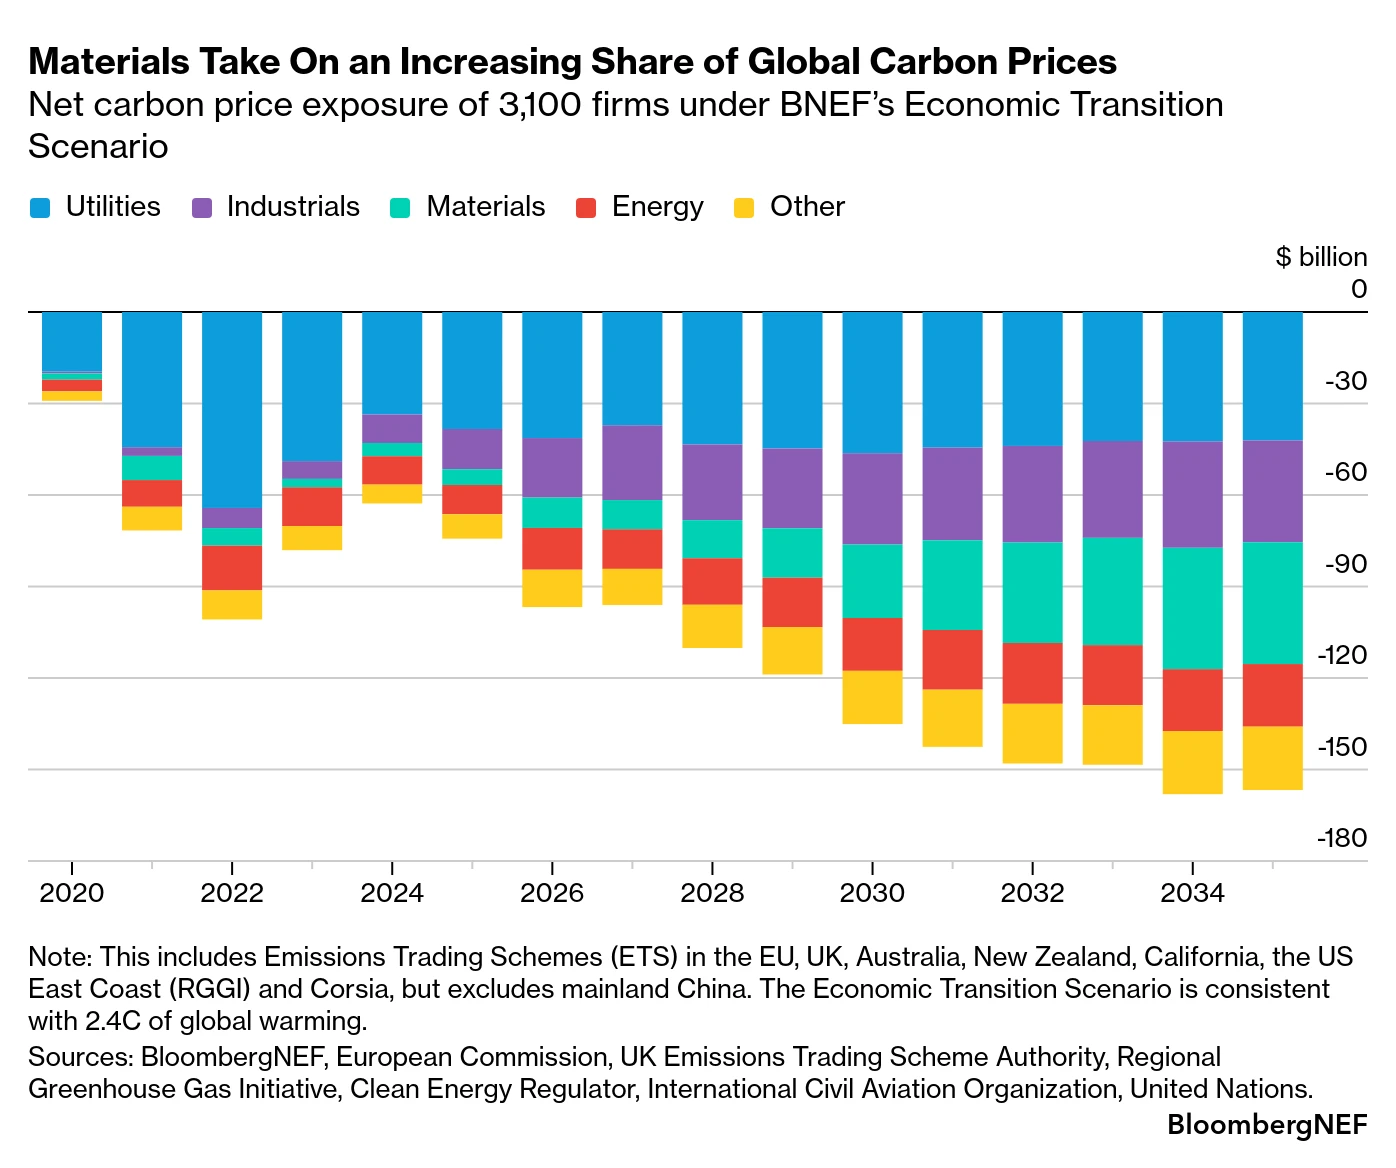
Net costs to corporates due to regulated carbon markets jump to $157 billion in 2035, from $74 billion in 2025. Utilities, refiners, steelmakers and airlines carry the lion’s share of this increase. Yet while this figure is high, it’s against a net revenue opportunity of $559 billion by 2035 for the same firms in these sectors.
Many firms see both carbon pricing and new revenue opportunities in BNEF modeling. For example, higher demand, especially in Asia, supports revenue growth for airlines, while Corsia, a global carbon pricing scheme, should only moderately erode their cashflows. For a company like Emirates Airlines, the annualized carbon price exposure over the next 10 years sits at less than 3% of the projected revenue growth opportunity by 2035 in BNEF’s modeling.
By contrast, oil and gas companies face a double hit with refining and other activities being subject to higher carbon prices, alongside weaker demand for road fuels. Electrification and more fuel-efficient combustion cars are projected to displace 15.6 million barrels per day of oil demand in 2035, versus 3.2 million daily barrels in 2025.
The materials sector, including primarily steel producers, sees a major spike in carbon costs in the coming years. Come 2035, it accounts for more than a quarter of total corporate carbon costs in BNEF’s modeling, up from 10.7% today. While free allowances and generous baselines limit this sector’s carbon price exposure today, a phase-out of the former and fewer decarbonization options make carbon pricing a larger risk in the years to come.
3. The energy transition boosts future revenues for corporates exposed to clean power grids and metals
A majority of the electric utilities modeled see growth from energy transition activities. Renewables, batteries and grids are all major revenue drivers, as population growth, rising incomes, and new loads like data centers and electric vehicles push up electricity demand worldwide.
Firms with heavy exposure to clean energy assets, like Adani Green Energy and Iberdrola, benefit significantly. Yet in Europe, grids become increasingly saturated with renewables, leading new capacity additions to peak in 2031. This restricts the longer-term upside potential for project developers and equipment manufacturers.
Metals and mining companies also see increased demand due to the energy transition. Rising copper demand for electric vehicles, EV chargers, electrical grids, batteries, energy storage systems, and renewable power infrastructure drive revenue growth for companies like Jiangxi Copper and Rio Tinto. Overcoming supply constraints will be critical for capturing this opportunity. Demand for cobalt and nickel also rises, benefiting companies like Jinchuan.
Capturing energy transition opportunities hinges on the implementation of a company strategy. For instance, many companies will have to build additional production capacity to supply new addressable markets. Downside risks modeled in this report come with greater certainty. This is because in a shrinking market companies stand to lose both from price depreciation and lower sales.
Approach: This report uses BNEF’s TRACT to model future revenues for 70,000+ companies, as well as future carbon costs from the CPET. The results incorporate scenarios modeled for three BNEF flagship reports: the New Energy Outlook, the Electric Vehicle Outlook and the Transition Metals Outlook.
For further information about the results provided in this research and our methodology, please reach out to support.bnef@bloomberg.com.
About
Client enquiries:
- Bloomberg Terminal: press <Help> key twice
- Email: support.bnef@bloomberg.net
Copyright
© Bloomberg Finance L.P. 2026. This publication is the copyright of Bloomberg Finance L.P. in connection with BloombergNEF. No portion of this document may be photocopied, reproduced, scanned into an electronic system or transmitted, forwarded or distributed in any way without prior consent of BloombergNEF.
The BloombergNEF (“BNEF”), service/information is derived from selected public sources. Bloomberg Finance L.P. and its affiliates, in providing the service/information, believe that the information it uses comes from reliable sources, but do not guarantee the accuracy or completeness of this information, which is subject to change without notice, and nothing in this document shall be construed as such a guarantee. The statements in this service/document reflect the current judgement of the authors of the relevant articles or features, and do not necessarily reflect the opinion of Bloomberg Finance L.P., Bloomberg L.P. or any of their affiliates (“Bloomberg”). Bloomberg disclaims any liability arising from use of this document, its contents and/or this service. Nothing herein shall constitute or be construed as an offering of financial instruments or as investment advice or recommendations by Bloomberg of an investment or other strategy (e.g., whether or not to “buy”, “sell”, or “hold” an investment). The information available through this service is not based on consideration of a subscriber’s individual circumstances and should not be considered as information sufficient upon which to base an investment decision. You should determine on your own whether you agree with the content. This service should not be construed as tax or accounting advice or as a service designed to facilitate any subscriber’s compliance with its tax, accounting or other legal obligations. Employees involved in this service may hold positions in the companies mentioned in the services/information.
The data included in these materials are for illustrative purposes only. The BLOOMBERG TERMINAL service and Bloomberg data products (the “Services”) are owned and distributed by Bloomberg Finance L.P. (“BFLP”) except (i) in Argentina, Australia and certain jurisdictions in the Pacific islands, Bermuda, China, India, Japan, Korea and New Zealand, where Bloomberg L.P. and its subsidiaries (“BLP”) distribute these products, and (ii) in Singapore and the jurisdictions serviced by Bloomberg’s Singapore office, where a subsidiary of BFLP distributes these products. BLP provides BFLP and its subsidiaries with global marketing and operational support and service. Certain features, functions, products and services are available only to sophisticated investors and only where permitted. BFLP, BLP and their affiliates do not guarantee the accuracy of prices or other information in the Services. Nothing in the Services shall constitute or be construed as an offering of financial instruments by BFLP, BLP or their affiliates, or as investment advice or recommendations by BFLP, BLP or their affiliates of an investment strategy or whether or not to “buy”, “sell” or “hold” an investment. Information available via the Services should not be considered as information sufficient upon which to base an investment decision. Bloomberg makes no claims or representations, or provides any assurances, about the sustainability characteristics, profile or data points of any underlying issuers, products or services, and users should make their own determination on such issues. The following are trademarks and service marks of BFLP, a Delaware limited partnership, or its subsidiaries: BLOOMBERG, BLOOMBERG ANYWHERE, BLOOMBERG MARKETS, BLOOMBERG NEWS, BLOOMBERG PROFESSIONAL, BLOOMBERG TERMINAL and BLOOMBERG.COM. Absence of any trademark or service mark from this list does not waive Bloomberg’s intellectual property rights in that name, mark or logo. All rights reserved. © 2026 Bloomberg.