The picture in 2025
Global sales of electric vehicles continue to rise and are set to represent one in four cars sold this year. But some markets are experiencing a significant slowdown, and many automakers have pushed back their EV targets. Electrification is spreading quickly in other areas of road transport, with buses and two- and three-wheelers already reaching very high levels of adoption.


Note: All figures are BloombergNEF’s outlook for 2025. Percentages are the share of new sales in each segment. Includes battery electrics and plug-in hybrids.
China dominates the global EV market, with over half of vehicles sold there now electric. Sales in the US are slowing and face uncertainty due to policy changes, while some emerging economies are experiencing record sales as more low-cost electric models arrive targeting local buyers.
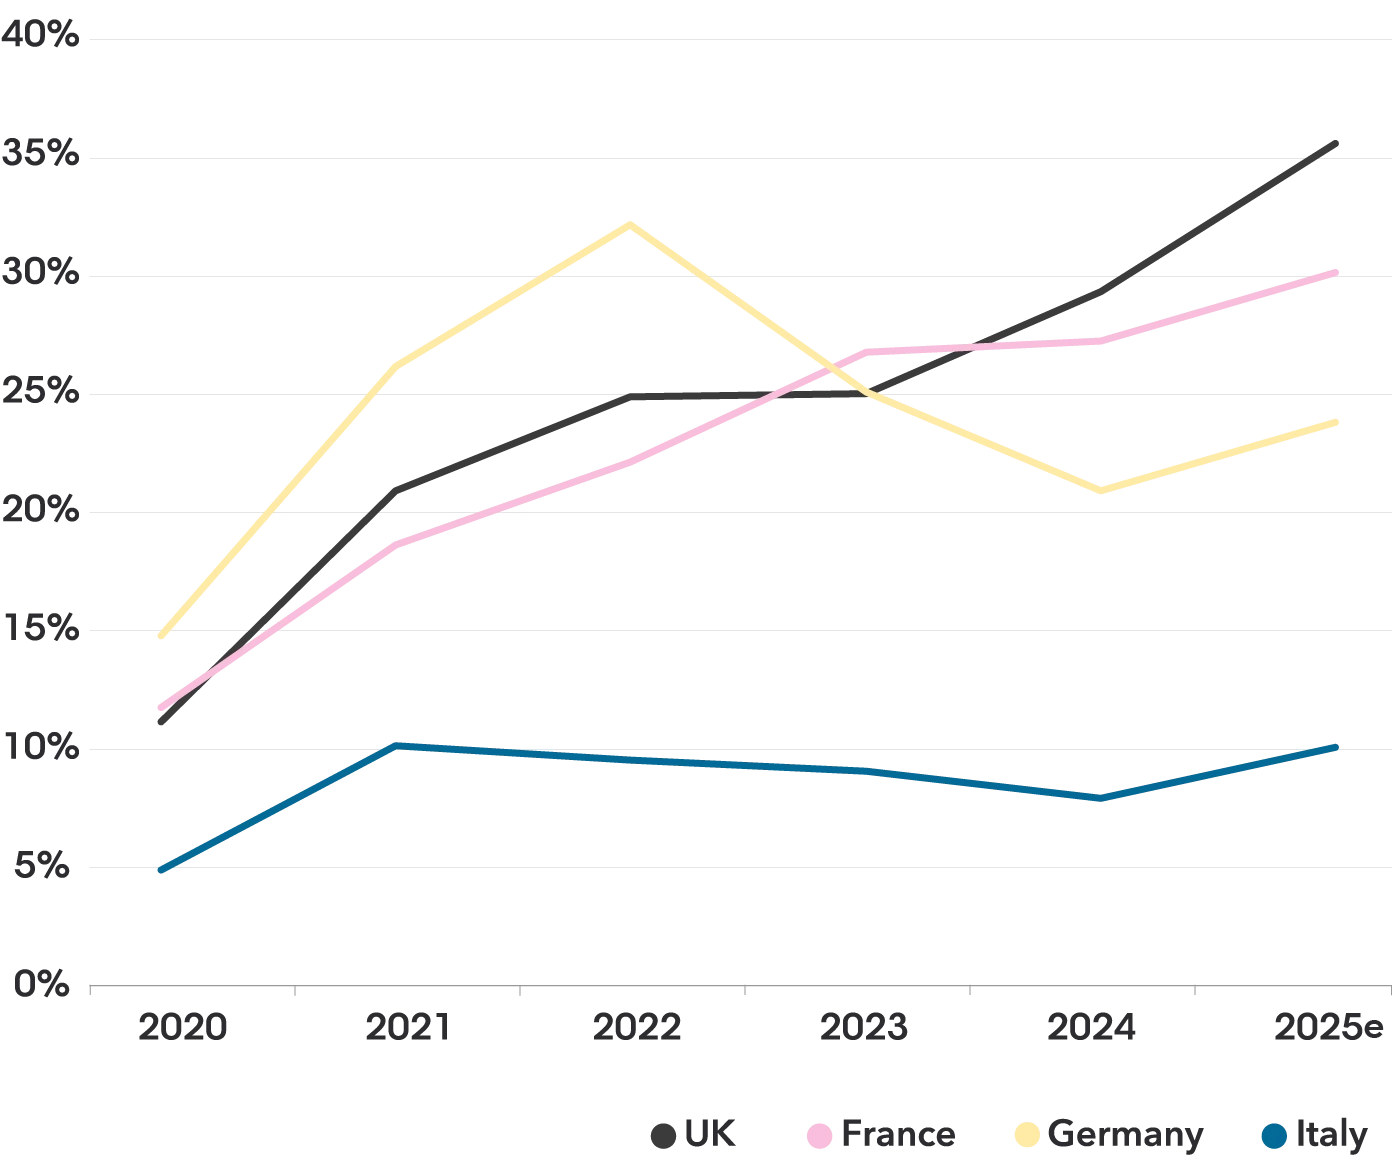
Global passenger EV sales by market


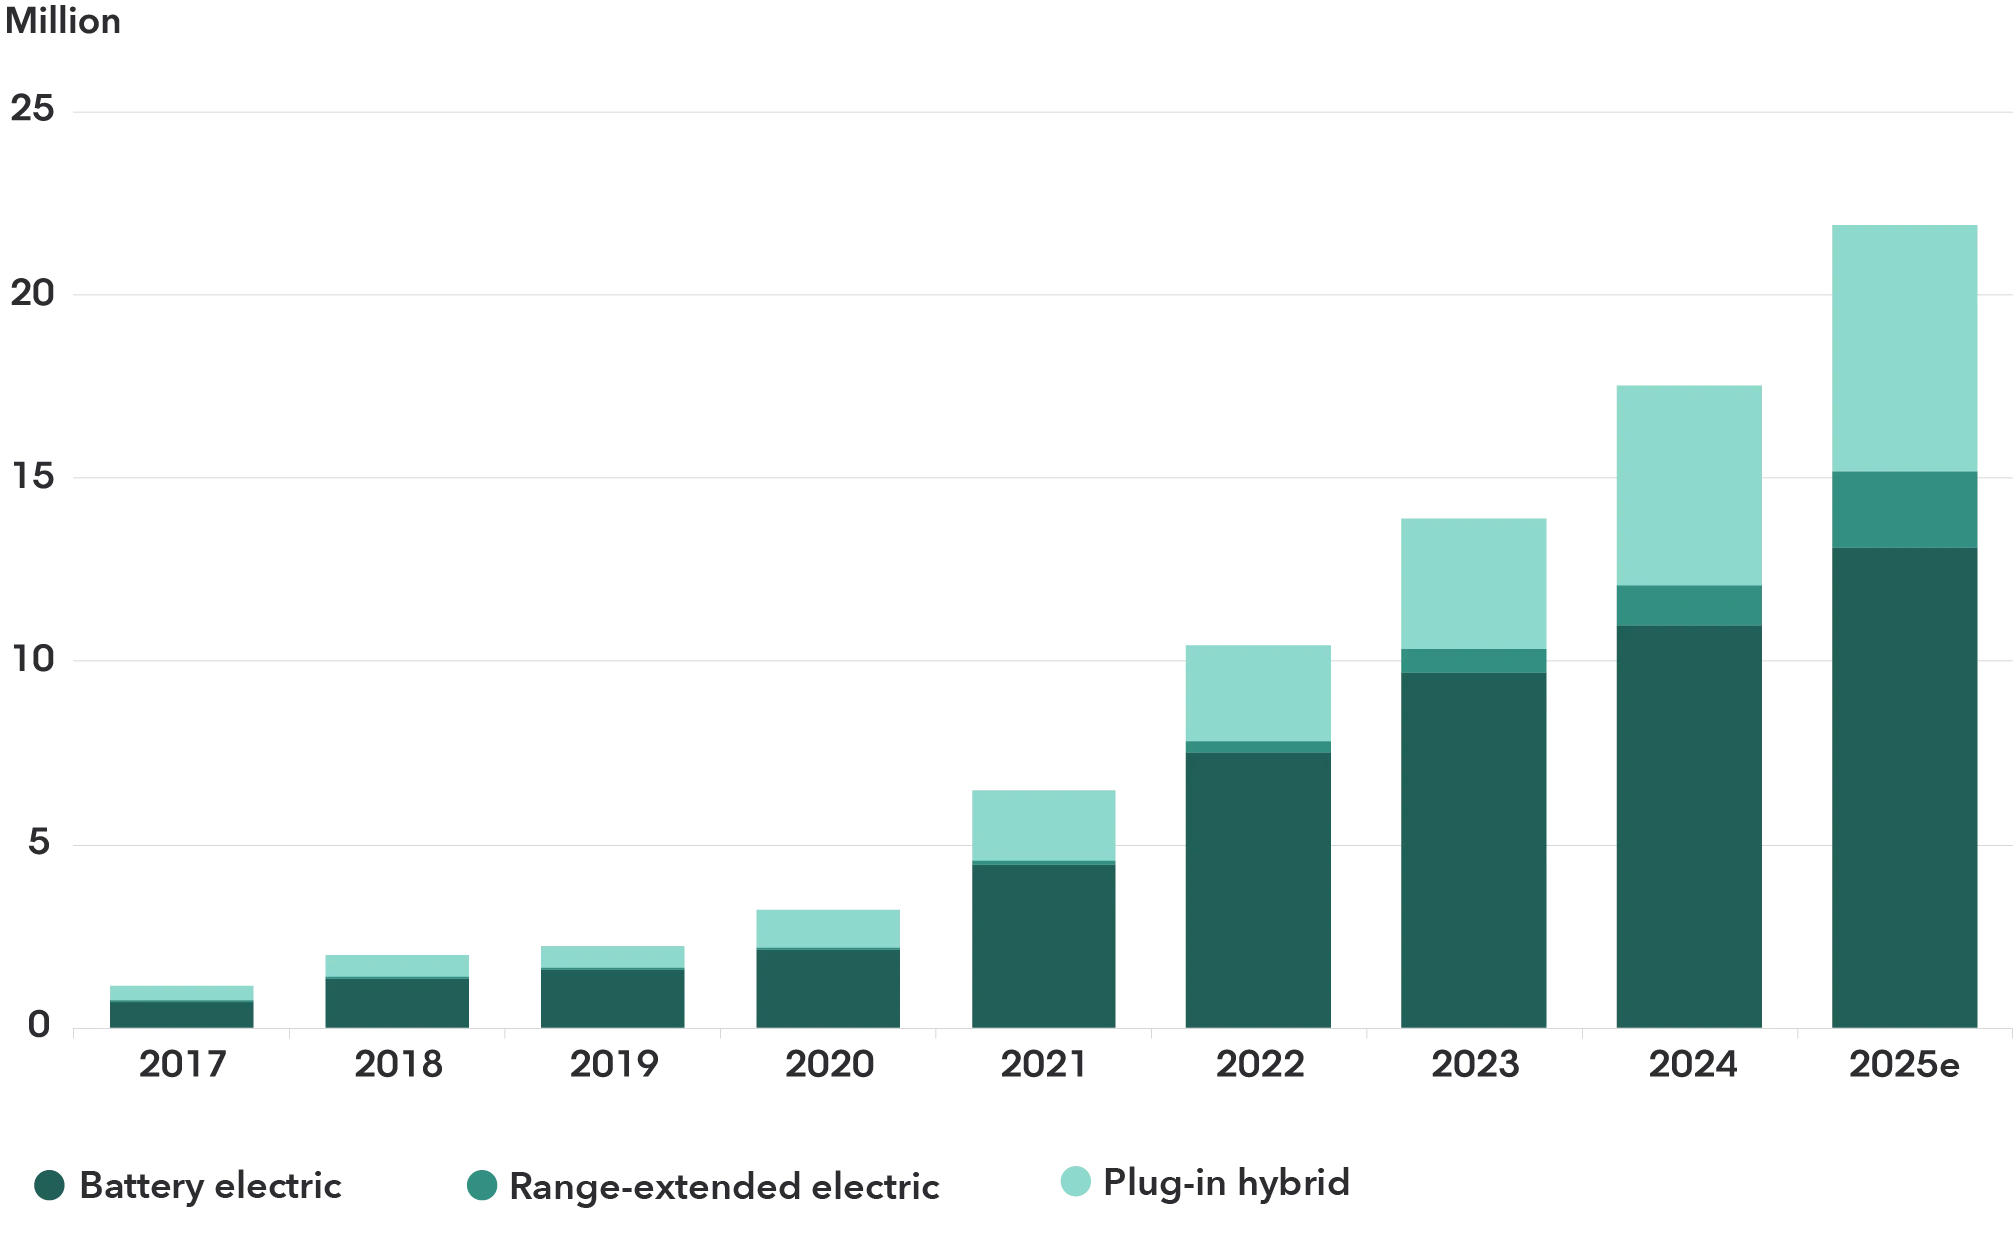
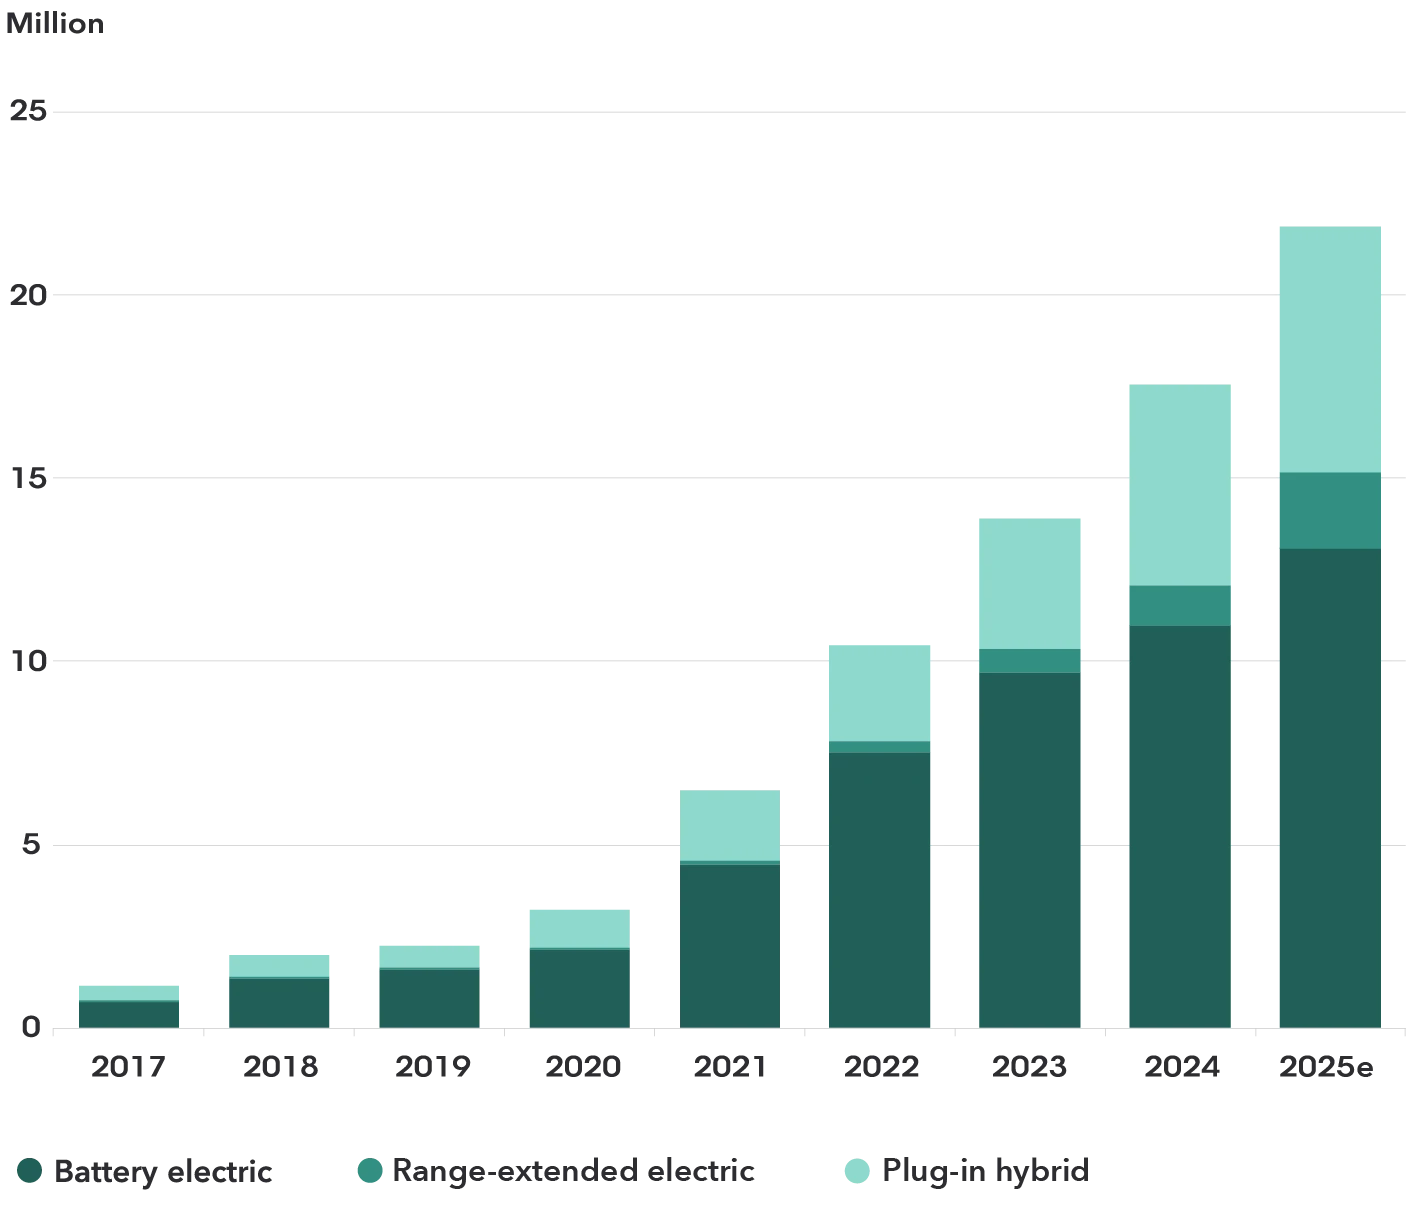
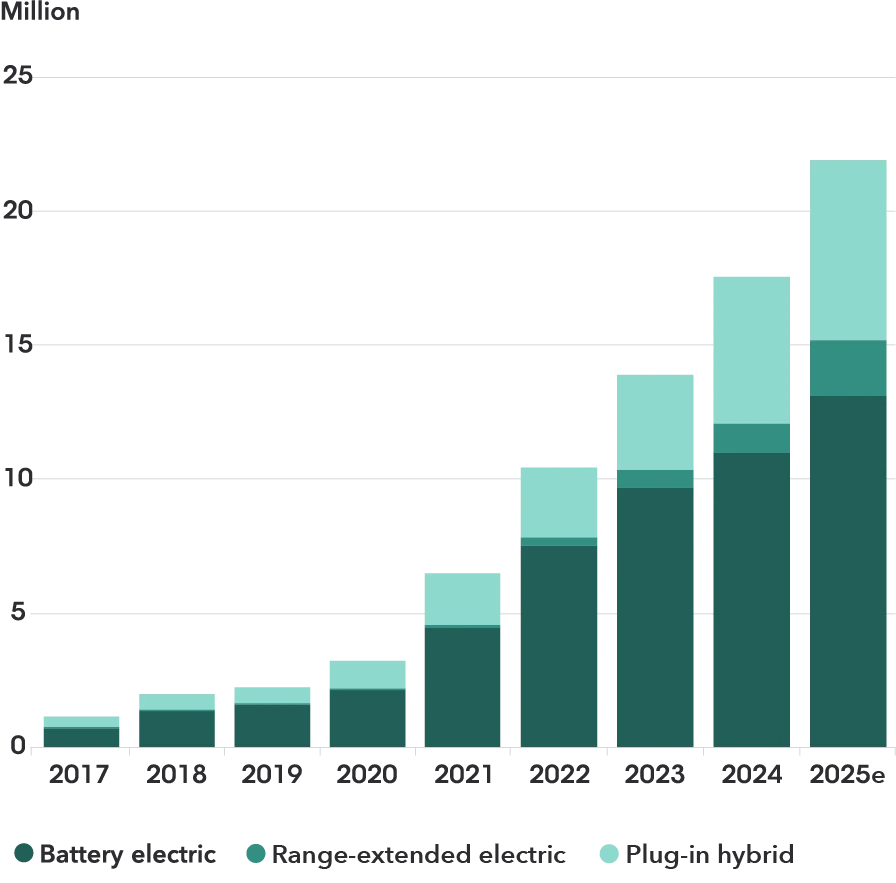
Global passenger EV sales by drivetrain
EV charging infrastructure
More and more charging points are being built, but prices are rising in many markets. Each country will have its own optimal mix of home, workplace and public chargers.
Cumulative global public charging connectors


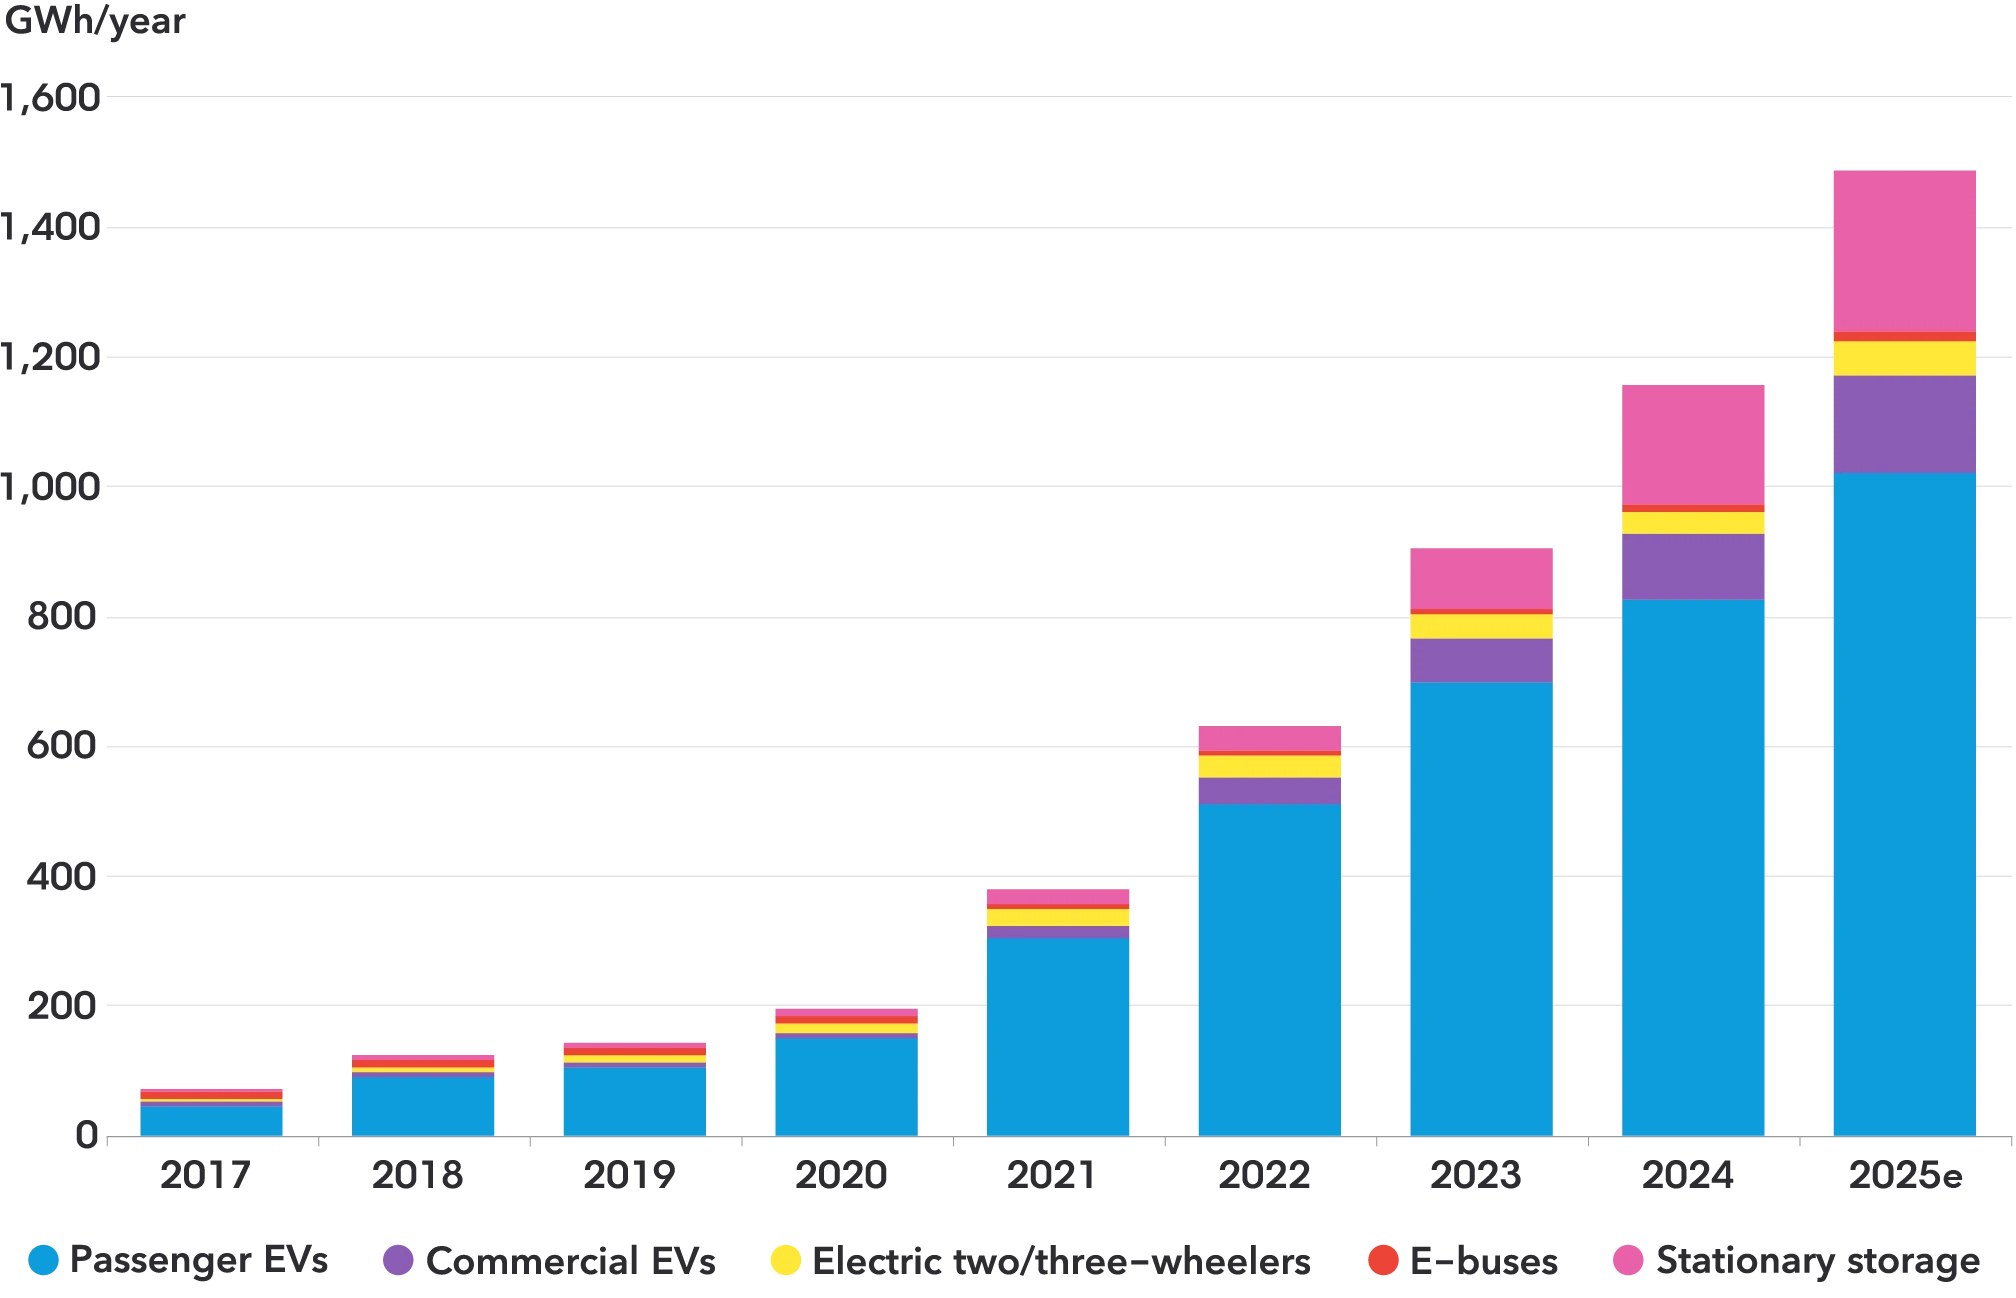
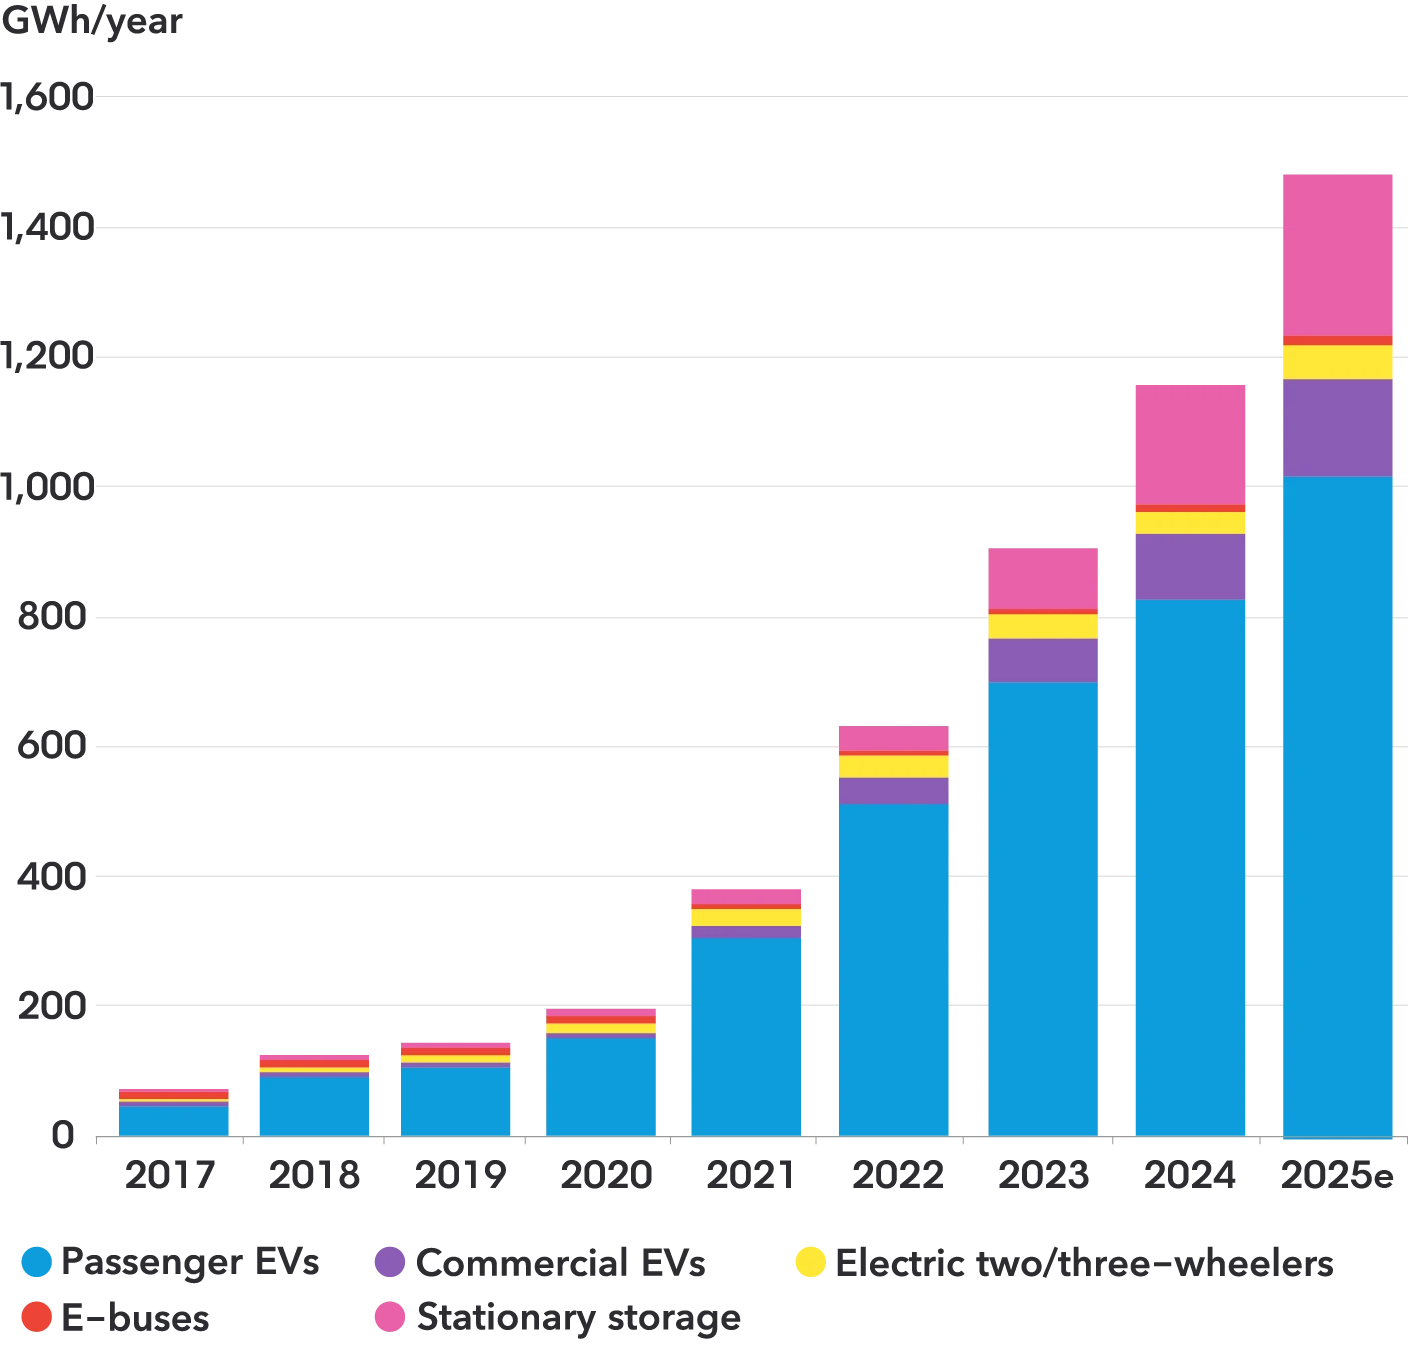
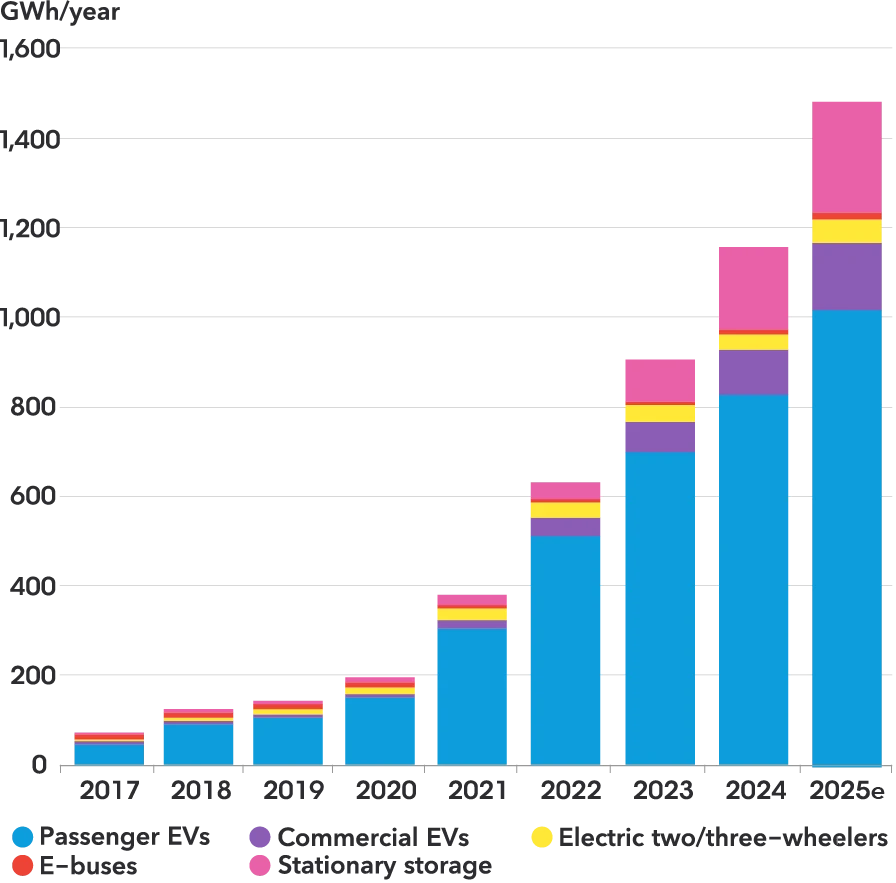
Lithium-ion battery demand
Despite rising demand, there is significant overcapacity among battery manufacturers, which has helped drive prices down. Battery demand for stationary storage is also growing rapidly as vendors look for new markets.
Annual lithium-ion battery demand by application


New features in this year’s outlook
- More countries covered: this year’s outlook includes 14 major auto markets as well as a detailed breakdown for additional EU countries
- Additional analysis on the growing role of range-extended EVs (eREVs)
- A new lithium-ion battery cathode, anode and electrolyte forecast for different vehicle segments and markets
- New analysis on battery manufacturing overcapacity
- Additional coverage on the impacts of tariffs and trade
Thematic highlights
This year’s EV Outlook also includes three thematic highlights, each of which explores a different part of the transition in vehicle markets around the world:


Key numbers
Expected growth in global passenger EV sales in 2025
Risk-adjusted lithium-ion cell manufacturing capacity by the end of 2025 – double expected demand
Road transport oil demand peak
Passenger EV sales in 2030, up from 17.6 million in 2024
EV electricity demand growth from 2025 to 2030
Total announced, under construction, and fully commissioned solid state battery manufacturing capacity in China
Get the free Executive Summary
Enter your details to download the executive summary and find out more on the implications of EV adoption for energy markets, raw materials, emissions, charging infrastructure and more.
BNEF clients can access the full report, including the breakdown by segment, technology and region, as well as the underlying Excel data and previous editions.

Authors

Colin McKerracher
Lead author

Aleksandra O’Donovan
Passenger vehicles

Dr. Nikolas Soulopoulos
Commercial vehicles and freight

Andrew Grant
Lead modeler

Jinghong Lyu
Modeling and shared mobility

Siyi Mi
Two and three wheelers, China

Komal Kareer
Two and three wheelers, India and Southeast Asia

Maynie Yang
Commercial vehicles and buses

David Doherty
Oil

Claudio Lubis
Oil

Huiling Zou
Vehicle economics

Shananthan Kalaichelvan
Electric vehicles

Ryan Fisher
Charging infrastructure and electricity demand

Madeleine Brolly
Charging infrastructure

Ash Wang
Charging infrastructure

Siong-Hu Wong
Modeling and autonomous vehicles

Evelina Stoikou
Batteries

Dr. Andy Leach
Batteries

Jiayan Shi
Batteries

Yayoi Sekine
Batteries

Dr. Kwasi Ampofo
Metals and mining

Peng Xu
Metals and mining

Vinicius Nunes
Brazil

Jade Patterson
Renewable fuels