
By Seb Henbest
Lead author, New Energy Outlook
Head of Europe, Middle East and Africa
Bloomberg New Energy Finance
In the last 10 days, I have been travelling around North America presenting to senior executives from energy companies, policy-makers and investors a long-term forecast for the world’s electricity system that would have been seen as wildly fanciful just a decade ago. And that’s putting it politely.
It’s a measure of just how rapidly things are changing in energy, particularly with the steep and remorseless reduction in the cost of cleaner options, that the reaction to BNEF’s New Energy Outlook 2017 forecast, published this month, has been totally different from that. The questions that my colleague Elena Giannakopoulou, senior analyst on the project, and I have been hearing have mostly begun with “how much” or “how fast” – not with “whether”, “how on Earth” or “what the blazes?”
Events are moving rapidly, and that is evident in the way energy system forecasts from industry players, such as BP, ExxonMobil and the International Energy Agency, have shifted in the last few years. BNEF’s work differs from those – we like to think it is a few steps ahead – but it is mostly a matter of degree, not direction.
So what are we saying in New Energy Outlook, or NEO, 2017? Before I list this year’s 10 high-level messages, just a reminder what NEO is, and is not. It is not based on how we think policy on clean energy or climate change might evolve between now and 2040. Instead, drawing on the work of 65 analysts, NEO is based squarely on the changing economics of electricity generation. Starting with a forecast for electricity demand, peaks and profiles, we first consider projects under development and our near-term industry forecasts, before modelling the supply mix using our in-house, least-cost optimization model. NEO explicitly removes renewable energy subsidies once they have run their course, and does not assume aspirational national climate targets are met, unless a mechanism to ensure compliance has been legislated.
OK, I promised 10 key messages for energy in 2017-2040. Here they are:
- Solar and wind dominate the future of electricity
- Solar’s challenge gets more serious
- Onshore wind costs fall fast, and offshore falls faster
- China and India are a $4 trillion opportunity for the energy sector
- Batteries and new sources of flexibility bolster reach of renewables
- Homeowners’ love of solar grows
- Electric vehicles bolster electricity use and help balance the grid
- Coal-fired power collapses in Europe and the U.S., peaks globally by 2026
- Gas is a transition fuel, but not in the way most people think
- Global power sector emissions peak in just over ten years, then decline
The following paragraphs will dig into each of these points in more detail.
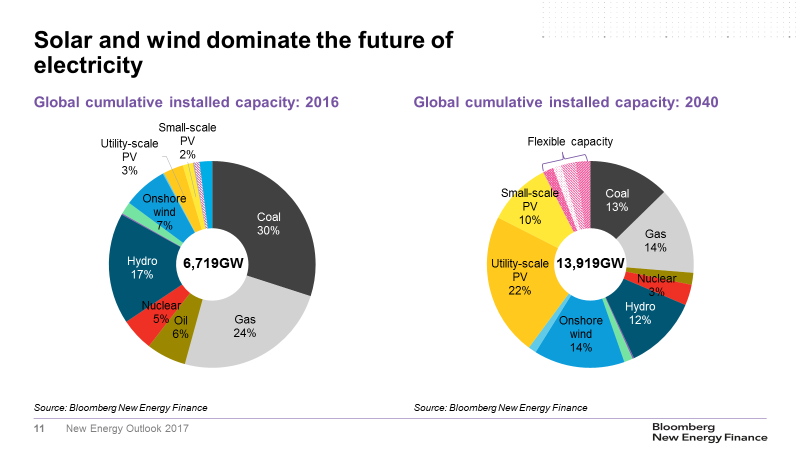
Around $6 trillion of new investment in wind and solar power between now and 2040 will reshape the world’s electricity markets as we move from a system where coal, gas and oil-fired power plants make up over 60% of capacity, to one where solar and wind are the two largest categories, and where fossil fuels make-up less than a third.
Electricity demand worldwide grows 58% to 2040 and this is met by a doubling of installed capacity to 13,919GW in 2040 from 6,719GW today, with wind up 349% and solar expanding a whopping 14-fold, split between 69% grid-scale and 31% small-scale installations. In addition, we expect growth in new sources of system flexibility, including batteries and demand response, such that by 2040 flexible assets make up around 7% of total installed capacity – similar to size of oil-fired power today. Just under 50% of global investment in new power capacity to 2040 will be in Asia-Pacific and the bulk of that – around $4 trillion – will flow to China and India.
What determines these high-level conclusions are the relative economics of coal, gas, wind and solar power, country by country, over the next 24 years. And the challenge thrown down by renewable energy is perhaps best exemplified by solar PV. Based on data going back to the U.S. space program, we can extract an experience curve that describes the price decline for every doubling of capacity. Last year we said that rate of decline was 26.5%. But after the BNEF solar team reanalyzed the data in January, we upped it to 28%. Solar PV is getting cheaper, faster than we thought. Modules are down 90% in price since 1990; and solar electricity has got 72% cheaper since 2009, with another 67% reduction forecast by 2040.
The same applies to wind energy. Looking at the decline in the price per MW of onshore wind turbines over time, we can extract a 9% experience rate. However, the wind turbine built today is fundamentally a very different machine to the one from 2008. Over time, wind turbines have not just got cheaper, they have also got more efficient at extracting energy from the wind field, with average capacity factors rising from around 15% at the start of this century, to almost 30% for new projects today.
As solar and wind costs continue to decline sharply, it becomes a matter of when, not if, these technologies get cheaper than other forms of power generation.
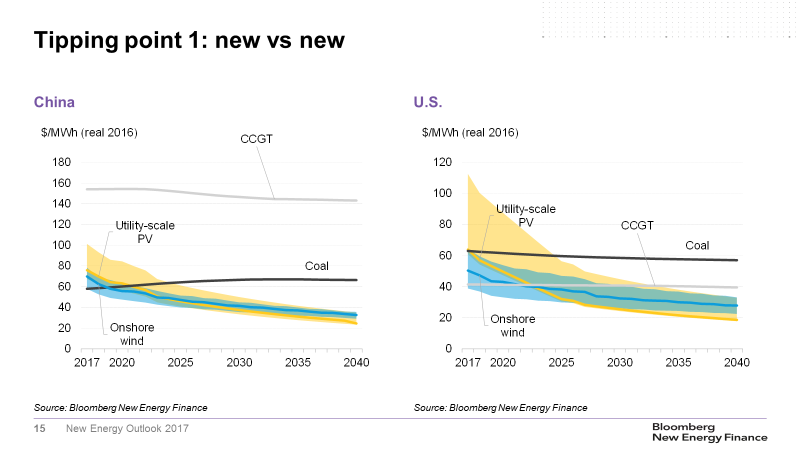
We see two tipping points ahead. The first is when a new solar or wind project can compete directly with a new coal or gas plants in the absence of subsidies. The second is when that new solar or wind project is cheaper than continuing to run coal and gas power stations that are already built.
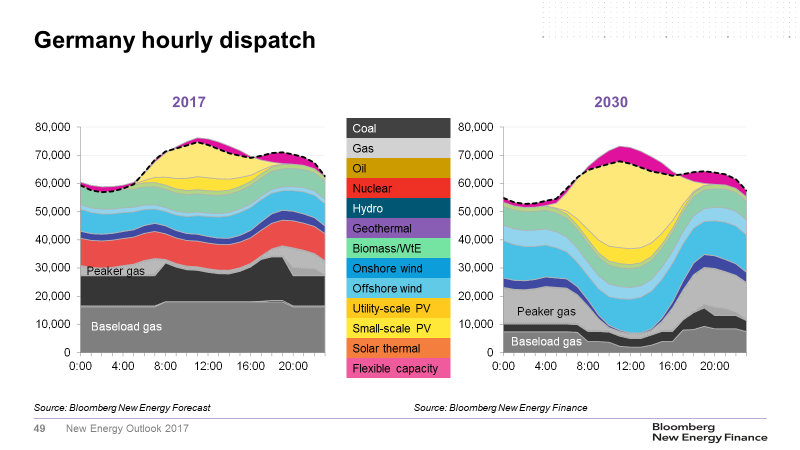
Tipping point one is either already, or almost, upon us in all major markets. In Germany, new onshore wind and solar already appear to be cost-competitive with new coal and gas; in China today, coal is the lowest-cost, new-build electricity generation, but in 2019, onshore wind gets cheaper, then PV follows two years later; in the U.S., cheap natural gas makes it the lowest-cost source of new electricity right now, but by 2022-23 PV and wind both begin to beat it; and in India, new solar PV starts to look cheaper than new coal, across the country, from 2020.
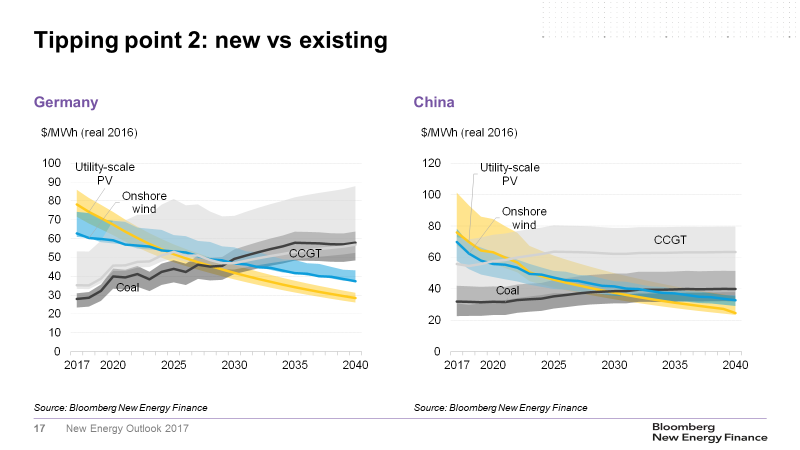
Not only do solar and wind get cheaper than coal and gas on a new-build basis, they also start to undercut existing fossil fuel plants. We define this as tipping point two, and our analysis suggests this is going to happen much faster than most people think. In China, PV gets cheaper than running an existing coal plant by 2030; in the U.S. PV beats existing gas by 2027; and in Germany, new solar and onshore wind undercut existing coal and gas generation between 2027 and 2030.
These two tipping points paint a dramatic picture of the rapidly changing economic calculus that we think will shape the future of energy. That said, these signals will be affected by policy and the inertial politics of vested interests. It is therefore very likely that these tipping points will not suddenly result in a wholesale shift in electricity generation but, as is often then case, policy and politics will lag technology. But when they do catch up, it may all come in a rush.
One of the big surprises in the news on clean energy in the last year has been offshore wind. Cost declines have been remarkable. A combination of near-shore sites, competitive tendering and a deliberate effort to de-risk project development has allowed prices to fall as low as $50 per megawatt-hour in Denmark, the Netherlands and Germany for projects coming on-line from 2020. By 2040, we think that offshore wind will be 71% cheaper than today, at about $37 per MWh as a global average. And while we don’t think it will ever be as cheap as onshore wind or PV, the combination of scale, high capacity factors, easier politics and more stable output than other variable renewables increases its value.
As more variable wind and solar generation enter the system, new sources of flexibility are going to be increasingly important. Coal and gas plants that can be ramped up and down and dispatched when required currently provide the bulk of flexibility to electricity systems. However, as these plants reach their end-of-life or are forced out by cheaper solar and wind, new sources of flexibility – such as batteries and demand response – will need to be added. A lot of the early successes with utility-scale batteries have been in relatively small markets such as ancillary services.
However, batteries can also help manage peak demand, and in NEO 2017 we have explicitly modelled the value of lithium-ion batteries compared with other technology options – in particular open-cycle, or “peaker”, gas plants. Batteries are best at providing power very rapidly for relatively short durations, making them ideal for hitting narrow peaks. However, their application is somewhat self-limiting, as each additional battery unit lengthens the remaining peak requirement, ultimately requiring larger, higher-cost battery systems that can discharge for longer periods. So, even as batteries get cheaper, their application can get more expensive.
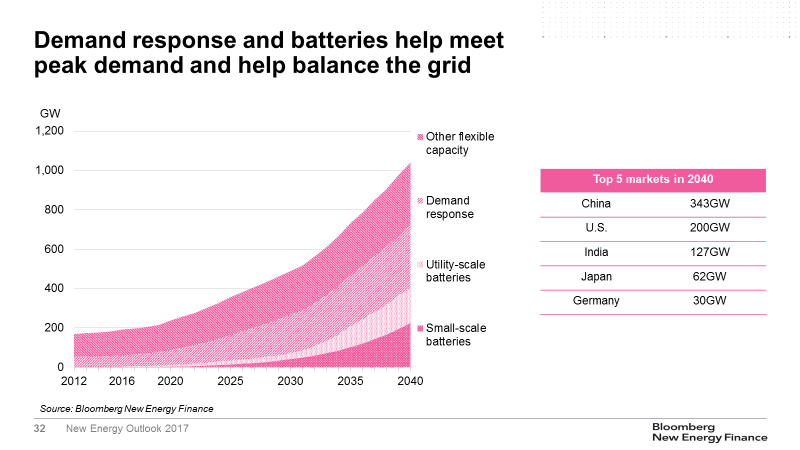
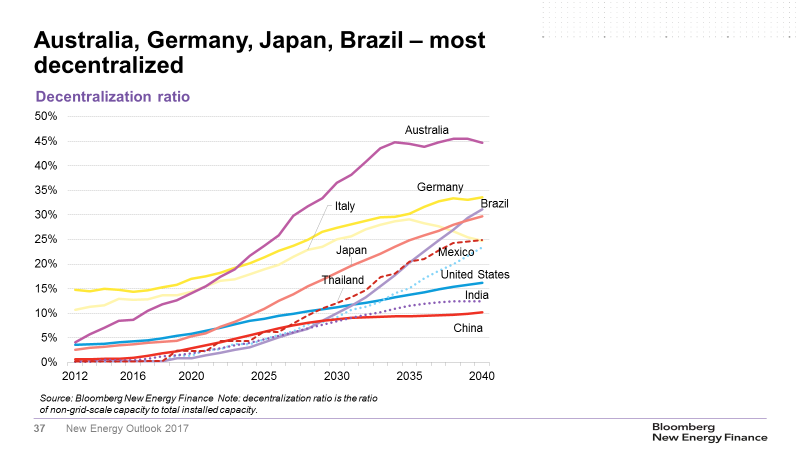
Overall, about 45% of our battery forecast is utility-scale, the remainder is small-scale. We anticipate that small-scale batteries will be deployed alongside rooftop PV system by households and businesses, particularly after 2025, when the cost of combined systems starts to be within reach of mainstream consumers. Small-scale PV is already at “socket parity” in countries like Australia, Germany and Chile, where there are high electricity prices, good sunshine, or both. Over time, the ongoing decline in the cost of PV means self-generation is likely to take off in all major markets – the biggest being China and Europe, and the fastest growing Latin America including Brazil. And by 2025, China, the U.S. and almost all of Europe will be at socket parity. Tariff reform, shifting more of the total cost to fixed rather than variable charges, could upend these conclusions.
Combining small-scale solar, small-scale batteries and distribution-grid-level demand response, provides a measure of the increasing decentralization in the future electricity system. Australia sets the pace, with as much as 45% of total capacity located behind-the-meter by 2040. We think that Brazil, Japan, Mexico and Germany are each likely to have a decentralization ratio of over 30%. This represents a shift in value downstream towards consumers at the expense of grid-scale assets.
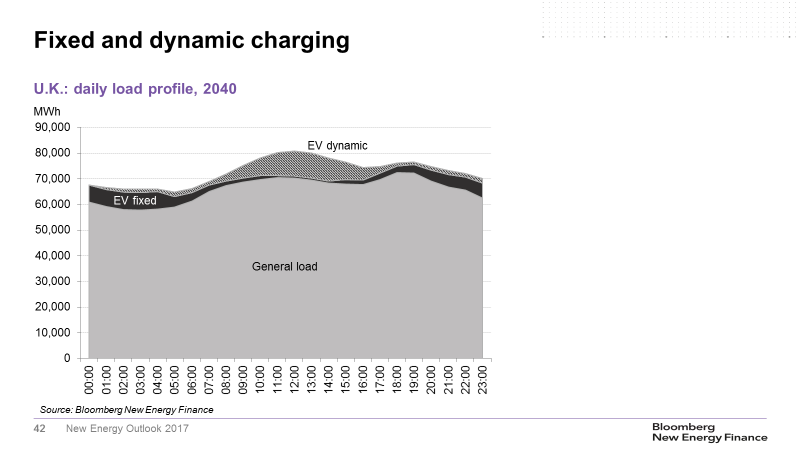
The rise of electric vehicles offers to arrest the decline in net grid demand that we would otherwise expect to see as behind-the-meter solar booms. The competitiveness of EVs comes down to battery prices, and these too are falling fast. Since 2000, the market price for li-ion battery packs is down 73%, and we expect prices to fall a further 73%, to $73 per kWh by 2040. The result is a very big EV story which adds around 14% new electricity demand in the U.K., 11% in Australia and 10% in France.
However, it’s not just the total amount of new electricity demand EVs add that matters, it also matters when these vehicles charge. In NEO 2017, we have assumed that half the EVs on the road in 2040 can do smart charging – that is, they can charge throughout the day, whenever prices are low. Allowing smart charging tends to push EV demand to times when there is an excess of renewable generation and by 2040 that’s increasingly during daytime hours when PV is at maximum output. In this way EV demand can follow supply, which helps to smooth out load profiles and better integrate new renewables. It also supports PV plants, which might otherwise be struggling to find demand for their electricity.
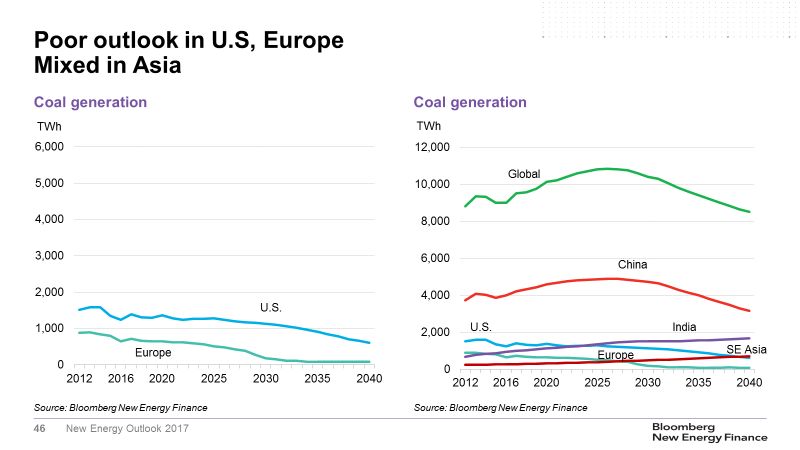
An ageing fleet and the influx of renewables result in the collapse of coal-fired electricity generation, in Europe and the U.S., falling by 87% and 51% respectively by 2040. However, heralding the end of coal would be extremely premature as it will continue to be central for some time, particularly in Asia. China currently runs the world’s largest coal fleet by some way and we expect a further 20% growth in coal-fired generation in that country, before a peak in 2026 and fall thereafter. In India, coal generation continues to grow, but cheaper solar means we now anticipate a much slower increase, of just 50% from 2020 to 2040, compared to 130% in last year’s assessment. Overall by 2040, we think that global coal generation will be 5% down from where it is today.
Gas-fired electricity, on the other hand, does grow, up 10% by 2040. But we don’t see it playing a “transition fuel” role in the commonly understood sense, whereby carbon-intensive coal gives way to less-carbon-intensive gas, before this too yields to renewables. Wind and solar are just getting too cheap, too fast. Gas does not win more than a third of the market lost by coal. One exception is perhaps the U.S. where cheap $2-3/MMBtu gas has already started to push coal out of the mix. However, even here the age of gas may be limited once the tipping points for solar and wind are reached.
Instead, gas appears likely to be an important ingredient in the “glue” that helps bind the electricity system together, offering supply-side flexibility to help meet extremes and when renewable generation is at a minimum. We anticipate over $800 billion of new investment and a 16% increase in gas capacity to 2040, with the bulk of this running only a fraction of the time.
The combination of large amounts of close-to-zero running-cost wind and solar, and low capacity-factor gas plants in a cost-optimized system, strongly supports new market reform to ensure both are adequately remunerated for the system services they can provide. This subject was addressed at length in last month’s VIP Comment from my colleague Albert Cheung, and in a White Paper by Michael Liebreich, and will be an important research focus for BNEF over the coming year.
Finally, on emissions – we expect 10% growth in global power sector emissions over the next ten years as faster demand growth in China, and higher gas prices in the U.S. increase coal burn. China runs easily the biggest coal fleet in the world, so more than any other country, it will determine future emissions. This year we have emissions peaking in 2026, the same year as coal generation in China, and falling thereafter at one percent per annum, to four percent below 2016 levels by 2040. This is higher in the near term in line with restated expectations for Chinese demand growth, but falls more rapidly beyond 2030 as cheaper renewables weigh heavily on coal in both China and India.
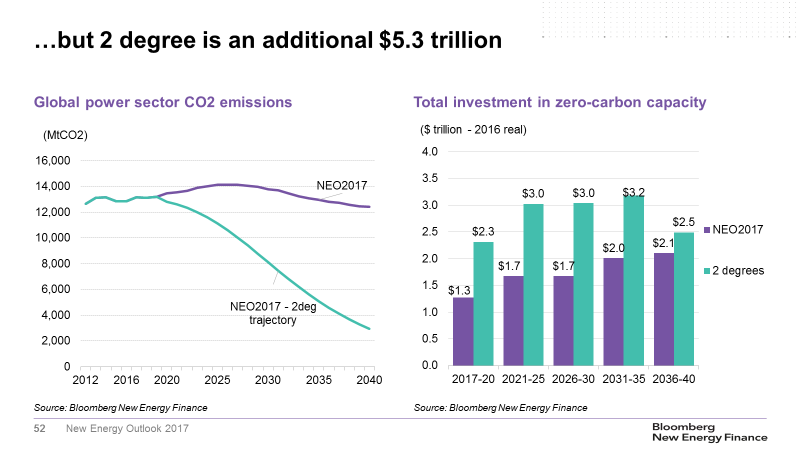
This emissions trajectory puts the world broadly on-track to meet the Nationally Determined Contribution targets defined under the Paris Agreement, and our analysis suggests there is definitely scope to ratchet up ambition without incurring additional costs. However, there remains a large gap to anything resembling a 2-degree Celsius scenario. The task is slightly smaller than we projected last year, but would still require extra investment of around $5.3 trillion in zero-carbon generation between now and 2040 to bridge it. This creates significant additional climate policy risk and the possibility that the dramatic changes we are painting to 2040 in NEO 2017, may very well be accelerated.
This opinion piece is an edited version of speeches made by Seb Henbest in London on Friday June 16, to launch NEO 2017, and at meetings in the U.S. the following week.
The NEO 2017 report, written by Seb Henbest and a team led by Elena Giannakopoulou, Head of Energy Economics at BNEF, is available to BNEF clients on web and on the Bloomberg Terminal. Non-clients can access the main findings here.
Related Content


